![]()
![]()
![]()
Use LEFT and RIGHT arrow keys to navigate between flashcards;
Use UP and DOWN arrow keys to flip the card;
H to show hint;
A reads text to speech;
112 Cards in this Set
- Front
- Back
|
Phylogenetic Tree |
A diagram showing (inferred) evolutionary relationships (ancestor-descendant) among organisms and/or bigger populations |
|
|
Parts of Phylogenetic Tree! |
Taxa, tips, nodes, branches, sister groups |
|
|
Methods of Building Phylogenetic Trees |
Phenetic, Cladistic or Probabilistic |
|
|
Phenetic Phylogenetic Tree |
Uses a criterion of similarity based on morphological or genetic distance among taxa. Takes that info to create a distance matrix or pairwise comparisons. |
|
|
Problem with Phenetic Approach |
Similarity can be due to convergent evolution instead of ancestry |
|
|
Cladistic Phylogenetic Tree |
A system for classifying organisms in which patterns of descent are the only criteria used (assumes maximum parsimony) |
|
|
Problem with Cladistic Approach |
Evolution does not always happen in the most simple (parsimonious) way! Ex: WHALES |
|
|
Probabilistic Phylogenetic Tree |
Criterion of synapomorphies among taxa Maximum likelihood |
|
|
Problem with Probabilistic Approach |
Deciding which model to use is not simple or easy. For morphology, the model for character transitions is usually unknown. |
|
|
Homology |
Similarity between traits that is because of common ancestry not convergence. Ex: gorillas and baboons are both quadrupedals because they are both descended from a quadrupedal ancestor |
|
|
Homoplasy |
Traits that are similar for reasons other than common ancestry. Convergent evolution (ie. ecological convergence) Ex: Dolphins and Ichysaurs |
|
|
Convergent Evolution |
Natural selection favours similar solutions to the same problem: traits are the same across different species but not because of common ancestry. ie: bird wings and bat wings |
|
|
Examples of Convergent Evolution |
Thylacine: the Tasmanian wolf is a marsupial that developed a dog-like form and tiger-like stripes |
|
|
Tetrapod Limbs |
Homologous (evolved through shared ancestry in many species) |
|
|
Wings in Bats and Birds |
Homoplasious (evolved in the two species NOT because of shared ancestry: convergent evolution) |
|
|
Tetrapod Transition |
The movement of organisms from water to land, gaining limbs! Swimming fish--> four legged vertebrates |
|
|
"Living Fossils" |
Old lineages now represented by a few live species Ex: Coelecanth from roughly 360 mya but there are still 2 living species! now! |
|
|
The Whale Transition |
Whales were thought to be an out-group of mammals, but actually went from water to land back to water: genetic data shows they are sisters of hippos! WHIPPO HYPOTHESIS (actually the most parsimonious) |
|
|
The Fossil Record |
The only direct evidence of what extinct species looked like, can give minimum ages for populations (can only be as young as the oldest fossil) |
|
|
How do Fossils Form? |
Burial of a dead organism preserved because of lack of oxygen, bacteria, and water slowing decomposition. |
|
|
Intact Fossils |
Decomposition of dead organism does not occur (trapped in amber). |
|
|
Compression Fossils |
Sediments accumulate and compress a dead organism into a thin film. |
|
|
Cast Fossils |
Remains of an organism decompose and create a cast in the remaining hole. |
|
|
Perminerlaized Fossils |
When organismal remains rot very slowly and dissolve minerals that infiltrate the interior of cells and harden into stone. |
|
|
The Rarity of Fossilization |
Fossilization is incredibly rare, occurring for only one in 200 million organisms! |
|
|
Limitations of the Fossil Record |
There is a distinct lack of transitional fossils in the fossil record! It has improved over the years but is still imperfect. |
|
|
Habitat Bias |
Organisms living in areas where sediment is actively deposited are more likely to be fossilized |
|
|
Taxonomic Bias |
Organisms with hard parts decay more slowly and are therefore more likely to be buried before decaying completely. |
|
|
Temporal Bias |
More recent fossils are more common than ancient fossils (though there are exceptions) |
|
|
Abundance Bias |
Some organisms are just more abundant and long-lived than others, leaving more evidence than local and/or ephemeral species. |
|
|
Timetrees |
Phylogenies + Fossils (relative divergences and relative ages based on phylogenies and minimum ages of clades based on fossils) |
|
|
Phylogeny |
The evolutionary relationships among a group of species, usually diagrammed as a family tree. |
|
|
How to assign a fossil to a clade |
A fossil must be younger than the divergence time of a certain clade to be assigned to it. Use cladistic analysis of the morphology for fossil and living member of a group: determine if crown or stem. |
|
|
Crown Group |
A living clade |
|
|
Stem Group |
The group that includes the crown group and all extinct species on the branch leading to the crown group. |
|
|
Molecular Clock |
The hypothesis that genetic change occurs at a constant rate and thus can be used to measure the time elapsed since two species shared a common ancestor. Based on observed regularities in the rate of genetic change along different phylogenetic lines. |
|
|
Adaptive Radiation |
The process in which a single lineage diversifies into a number of species, each characterized by distinctive adaptations. The diversification of the mammals at the beginning of the Cenozoic era is an example. |
|
|
Diversification Rate |
Speciation Rate - Extinction Rate |
|
|
What triggers Adaptive Radiation? |
Ecological opportunity and Morphological innovation |
|
|
Morphological Innovation |
Form of ecological opportunity where a new trait allows a species to access new ecological resources. |
|
|
How to Detect Adaptive Radiation |
Instances of rapid speciation from a common ancestry- may produce polytomy (star phylogeny) where it was so rapid it was impossible to estimate a phylogeny. There would also be phenotypic and environment correlation. |
|
|
Polytomy |
Star Phylogeny: when speciation is so rapid a phylogeny cannot be estimated |
|
|
Examples of Adaptive Radiation |
Insular birds/plants/lizards, Galapagos finches, Hawaiian silverswords/lobeliads, Caribbean Anolis lizards etc. omg so many like wat |
|
|
Timeline of Life |
Precambrian Super-eon, Phanerozoic eon: Paleozoic era, Mesozoic era, Cenozoic era (now! the anthropocene in the latter half) |
|
|
Precambrian Supereon (and important events) |
First 4 billion years of Earth's history: liquid water, origin of life, bacteria, eukaryotes, photosynthetic eukaryotes (oxygen), diversification of multicellular organisms |
|
|
Paleozoic Era |
Age of Trilobytes |
|
|
Radioactive Decay |
Spontaneous change from one isotope of an element to another isotope of the same element or to an entirely different element. Occurs at a constant rate that can be measured precisely! |
|
|
C14 to N14 (Carbon) Dating |
Carbon-14 is produced in atmosphere by cosmic radiation, taken up by living organisms who eventually die then C-14 decays into N-14 at a constant rate, measuring ratio of C-14 to C-12 (stable) in organic remains estimations of the time passed since the organism died can be made. |
|
|
Angiosperms |
The flowering plants. The radiation of the angiosperms during the Cretaceous period may have played an important role in the evolution of primates. |
|
|
Gymnosperms |
A group of plants that reproduce without flowering. Ex: pines, red-woods, firs |
|
|
Polygyny |
A mating system in which a single male mates with many females. Polygyny is the most common mating system among primate species. |
|
|
Hominins |
Any member of the family Hominoidea including all species of Australopithecus and Homo. |
|
|
Population |
Group of conspecifics living in the same area at the same time |
|
|
Population Ecology |
Why and how a population changes in size over time (predictions). |
|
|
First Law of Population Ecology |
Change in Pop Size (delta N) = BR - DR + Immigration - Emigration |
|
|
Negative Density-Dependence |
Curtailing of the growth of a population through increased death-rate, decreased birth-rate, increased emigration, and decreased immigration. |
|
|
Fecundity |
The actual reproductive rate of an organism or population measured through ability to reproduce (ie number of gametes). (Usually only count females) Variable "f" (for density independent) |
|
|
Survival Curves |
The fraction of an initial population surviving to certain ages represented on a logarithmic scale, three types. |
|
|
Type 3 Survivorship Curve |
Invertebrates, fish: JUVENILE MORTALITY |
|
|
Type 2 Survivorship Curve |
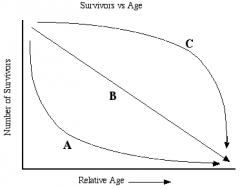
B) Birds; constant per-capita survival (same fraction of individuals dying each year) |
|
|
Type 1 Survivorship Curve |

C) Humans and sort of elephants; Senescence, almost all survive until a certain age |
|
|
Senescence |
The sudden decline in an organism or cell's ability to function (think dying because of age or old age and deterioration) |
|
|
Net Reproductive Ratio |
Number of daughters per prospective mother that will not survive to or through childbearing years. |
|
|
Mechanisms of Population Cycles |
Time lags, overcompensating density dependence, environmental variation, trophic interactions (predator-prey, pathogen-host) |
|
|
Trophic Interactions |
Interactions between organisms on different levels of the food chain ie. predator-prey, pathogen-host etc. |
|
|
Predator-Prey Cycles |
Predators kill prey, reducing their population growth rate- prey nourishes predators, increasing their population growth rate- eventually less prey decreasing the number of predators etc. Induced Population Cycle. |
|
|
Population Cycles |
The rise and fall of a population (size) that is predictable and recurring over time. Ex: Lynx-Hare and Red Grouse |
|
|
Lynx-Hare Cycle |
Tested to see whether the cycle of the hare population was caused by the lynx or the vegetation. (control plot, fenced in plot, extra food plot, fenced in and extra food plot) Keeping the lynx out and giving extra food prevented the decline part of the hare pop. Inconclusive results |
|
|
Red Grouse Cycle |
Do nematodes (worms/parasites) drive the cycle? (control moor, one treatment moors, two treatment moor) Treatment twice prevented the cycle from crashing almost entirely! |
|
|
Age Pyramids |
Snapshot of population size in different age categories often separated by sex) that give the effects of history! |
|
|
Population Momentum |
"Bulges" in an age pyramid moving through a population over time (ie. baby boomers) Bottom heavy younger pops keep growing even when fecundity drops. |
|
|
Intrasexual Conflict |
Male vs. Male competition. Traits evolved for combat and intimidation (horns, antlers, armour etc.) OR for sneaky-ness (males that look like females etc.) |
|
|
Intersexual Conflict |
Female Choice. Traits evolved to make females choose THEM! Ornate secondary sexual characteristics. |
|
|
Sexually Dimorphic Characteristics |
Characteristics that are not directly related to sex. Ex: size, armour, weapons, flashy displays, colour patterns, songs, fancy tails etc. |
|
|
The Sexy Son Hypothesis |
Females have a preference for a certain trait and the males with that trait get more mates, and the sons with that trait get more mates therefore: female preference and male trait coevolve. |
|
|
Sensory Drive Hypothesis |
Females have a preexisting preference for a certain trait (more visible traits) and the males are merely exploiting this preexisting preference. |
|
|
Direct Benefits Hypothesis |
Only viable if male is going to hang around after mating (for offspring). Male traits being chosen because of being honest signals of quality (male has access to resources, parasite avoidance etc.) and are hard to develop if the male isn't actually quality |
|
|
Good Genes Hypothesis |
Male ornaments (traits) as a signal of good genes. Because ornaments take a lot of resources only males with good genes have them. (Males DON'T stick around after mating) |
|
|
Lek |
A large open area where males go and stand around to advertise their dicks |
|
|
Handicap Principle |
See that male with the really big tail? He's still survivin' in fact he's thrivin'. As a matter'o'fact I'd tap that. Males have a trait that acts as a handicap but if they can live well with it females will want to mate with them! |
|
|
Bottom Up Factors |
Limiting factors in ecosystems that are needed for biochemical reactions, especially photosynthesis. (Ex: light, nutrients like nitrogen and phosphorus) |
|
|
Liebig's Law |
Whichever factor is least available will set the limit to how productive an ecosystem can be. |
|
|
Top Down Factors |
Limiting factors in ecosystems that regulate the rate of loss from the top of the food-chain by removing material from the ecosystem (Ex: grazers, fire, certain plants). |
|
|
Upwelling |
Marine: big change in water movement (Ex: current changing and bringing up nutrients from the bottom of the ocean!) |
|
|
Turnover |
Lakes: big change in water movement! |
|
|
Aquatic Depth Gradient |
Dark, cold, low productivity, nutrient accumulation vs. Light, warm, high productivity, nutrient depletion |
|
|
Whale Falls |
Donor Controlled: whales consume a lot at the pelagic (top) zone of the ocean and when they die their carcasses sink to the bottom and provide sustenance for tons of organisms! A type of Benthic Ecosystem. |
|
|
Benthic Ecosystems |
Deep ocean ecosystems. Donor controlled (ie whale falls) or Chemoautotrophic (ie cold seeps) |
|
|
Cold Seeps |
Chemoautotrophic: type of benthic ecosystem where hydrocarbons are released from the ground and organisms adapt to live there without sunlight! |
|
|
Potential Evapotranspiration |
Amount of evaporation that would occur if a sufficient water source was available. (= water + temperature). Can be a good estimate of what the vegetation will be like. |
|
|
Holdridge Zones |
Classifications of land areas based on potential evapotranspiration, actual precipitation, and temperature. |
|
|
Local Human Impacts |
Landscape Change: deforestation, ubanization (temp balance, water balance, runoff) Nutrient Enrichment: eutrophication: fertilizer being washed away (phosphate) |
|
|
Global Human Impacts |
Greenhouse gases, ocean acidification, species movement, changing climate patterns all occurring much more quickly because of humans! |
|
|
Behaviour |
Response to a stimulus over a short time scale (overlaps with phenotypic plasticity) |
|
|
Phenotypic Plasticity |
Things growing differently in different environments |
|
|
Proximate Cause of Behaviour |
How did the behaviour come to be: MECHANISTIC |
|
|
Ultimate Cause of Behaviour |
Why did the behaviour come to be: EVOLUTIONARY |
|
|
Rovers vs. Sitters |
Fruit fly gene variants: larvae that either wander far from their birthplace or remain close to it. Density Dependent fitness: rover beneficial in high densities. Pleiotropic: affects adult behaviour as well (exists in other insects) |
|
|
Rain Forest |
Temp: High and constant Precip: high but variable rainfall |
|
|
Desert |
Temp: Variable Precip: Low rainfall |
|
|
Grassland |
Temp: variable Precip: variable- low to medium rainfall *fire/grazing disturbance is very important |
|
|
Temperate Forest |
Temp: variable Precip: variable medium to high rainfall Trees: deciduous broadleaf |
|
|
Boreal Forest |
Temp: variable low Precip: low to medium rainfall Trees: evergreen needleleaf |
|
|
Tundra |
Temp: low Precip: low rainfall Vegetation: short and scruffy |
|
|
Ideal Free Distribution |
Organisms get equal resources meaning the resources are partitioned evenly, where the resources are is more crowded but an organism will move if they are doing worse. |
|
|
Handling Time |
pursuit + eating + digesting |
|
|
Searching Time |
The time it takes to find new food, inversely proportional to abundance of said food |
|
|
Energy Gain |
energy / (handling time + c / abundance) |
|
|
Preference (food) |
E / h |
|
|
Per Capita Population Growth Rate |
r = f (density independent fecundity) - μ (mortality) Useful for short-term predictions for low density populations |
|
|
Density Dependent Growth, Logistical Growth Model |
ΔN / Δt = rN(1 - N / K) K= carrying capacity N= population size
|
|
|
Carrying Capacity (metapopulations) |
The maximum population size of the species that the environment can sustain indefinitely, given the food, habitat, water and other necessities available in the environment. K = 1 - (e/c) e= extinction rate (per patch) c= colonization rate (per patch) |