![]()
![]()
![]()
Use LEFT and RIGHT arrow keys to navigate between flashcards;
Use UP and DOWN arrow keys to flip the card;
H to show hint;
A reads text to speech;
29 Cards in this Set
- Front
- Back
|
Definition |
Statistics - collection , classification, analysis and interpretation of numerical data (Coxten and Cowden) |
|
|
Principles of Biostatistic |
1. Collection of data 2. Organisation of data 3. Presentation of data 4. Analysis of data 5. Interpretation of data Basis for statistical analysis 1. The population (U) 2. The set of characteristics (variables) of the units of this population (V) 3. The probability distribution (P) of these characteristics in the population. |
|
|
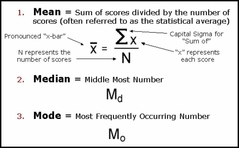
Measures of Central tendency- definition |
The value around which the other values are distributed. |
|
|
Measures of Central tendency- Objectives |
Condense entire mass of data and to facilitate comparison |
|
|
Measures of Central tendency- Ideal properties |
1. It should be easy to understand and compute. 2. It should be based on each and every item in the series. 3. It should not be affected be extreme observations (either too small or too large) 4. It should have sampling stability |
|
|
Measures of Central tendencies- types |
1. Arithmetic mean (mathematical estimate) 2. Median (positional estimate) 3. Mode (based on frequency) |
|
|
Arithmetic mean |
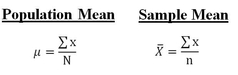
1. Simplest measure of Central tendency. 2. You can give examples😏 Advantage- 1. Easy to calculate and understand 2. It is the most useful of all the averages. Disadvantages- 1. May be unduly influenced by abnormal values. 2. Sometimes it may look ridiculous. |
|
|
Median |
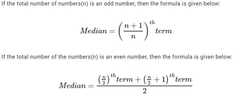
Middle value in the distribution such that One half have a smaller or equal value as of median and Other half have a larger or equal value as of median. 1. Arrange the data in ascending or descending order 2. Apply the formula . Advantage Not affected by the abnormal values Disadvantages No further analysis can be obtained For eg . If we have median of 2 groups. We can't get combined median of the 2. |
|
|
Mode |
The value in series of observations that has maximum repetition (frequency) 1. Look for highest frequency observation. Or 2. Apply formula 3 median - 2 mean Advantage- 1. Not affected by the abnormal values 2. Easy to calculate 3. Can be calculated in qualitative data. Disadvantages- 1. Can't be used for further analysis 2. There can be multiple or no modal value for a particular set of observations. 3. Less common. |
|
|
Measures of Dispersion |
Dispersion - the degree of spread or variation of a variable about a central value. The common measures of dispersion are- 1. Range 2. Mean deviation 3. Standard deviation |
|
|
Range |
Difference between highest and lowest observations. Advantage- 1. Simple to calculate. Disadvantages- 1. No info about values that lie between the extreme values 2. Subject to fluctuation from sample to sample. |
|
|
Mean deviation |
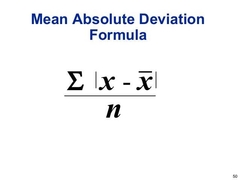
Average of deviations from arithmetic mean. Advantage- 1. Simple to understand 2. Easy to calculate 3. Takes all observations in consideration. 4. Values of extremes have a little effect on mean deviation. Disadvantages- 1. Not capable of further analysis and treatment. 2. More accurate when measured from median values (which in themselves are not reliable in a data with varieties of observations) |
|
|
Standard deviation |
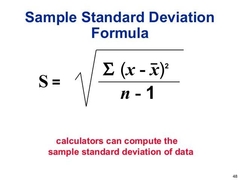
A.k.a. Root mean square deviation
The square root of mean of squared deviations from arithmetic mean
Greater the standard deviation, greater will be magnitude of dispersion for a given set of data. Advantage - 1. It is a sensitive measure of dispersion. 2. Takes all observations in consideration. 3. Greater precision. Disadvantages- 1. Not that easy to calculate. |
|
|
Presentation of data |
2 methods- 1. Tables 2. Charts and diagrams |
|
|
Bar Charts |

Method of data presentation by the length of a bar.
Width if bar remain same
Only the length varies. Bar is separated by spaces.
Can be 1. Horizontal or vertical 2. Simple, Multiple, Component (proportional). |
|
|
Types of data |
Nature of the data 1. Qualitative 2. Quantitative A) Discrete B) continuous Data collection 1. Primary 2. Secondary |
|
|
Primary data |
Obtained by investigator himself It is first hand information.
Methods of primary data collection- 1. Direct personal interview . 2. Oral health examination . 3. Questionnaire method. Write details, advantages and disadvantages. |
|
|
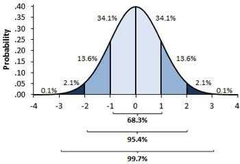
The normal curve |
A.k.a. normal distribution, Gaussian distribution.
When data is collected from a large no. of people and a frequency distribution is made with narrow class interval , The resulting curve is smooth and symmetrical K/a NORMAL CURVE. |
|
|
The normal curve- properties |
The limits on either side of mean are called confidence limits 1. The area between one SD on the either sides of the mean include 68.3% of values. 2. The area between two SD on either side of mean include 95.4% of values. 3. The area between three SD on either side of mean include 99.7% values. |
|
|
The standard normal curve |
There are many normal curves for a given set of data but there is only 1 standard normal curve. 1. Bell shaped. 2. Perfectly smooth 3. Based on an infinite no. of observations. 4. Measure of Central tendencies (mean median mode ) coincide. 5. Area of curve= 1 6. Mean = 0 7. SD = 1 |
|
|
Chi Square Test- scientist |
Karl Pearson |
|
|
Chi Square Test- Indications |
1. Data is measured in terms of attributes or qualities 2. Data is intended to test whether this difference in the distribution of attributes in different groups is due to sampling variation or not |
|
|
Chi Square Test- Uses |
Test the significance of difference between two proportions and can be used when there are more than two groups to be compared. |
|
|
Chi Square Test- Steps |
See last pages of CD notebook |
|
|
Correlation coefficient "r" |
Correlation between two variables r= -1 to +1 0 means no correlation -1 means negative correlation +1 means positive correlation |
|
|
Father of health statistics |
John Graunt |
|
|
Types of scales in statistics |
Nominal- info divided into some definitive quality basis Eg. Male/female, white/black Ordinal- rank order Interval - scale graded in equal increments. 0 doesn't mean absence of character Eg. Temperature Ratio scale- has absolute zero Eg. Ht , wt |
|
|
Sampling methods |
1. Non Probability - quota - purposive (subset- snowball or chain referral) - convenience 2. Probability - simple random (lottery, table of random no.) - systematic - stratified #str. Random, #str. Systemic - cluster 3. Other - multiphase - multistage |
|
|
Coefficient of variance |
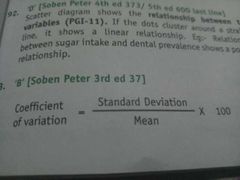
|