![]()
![]()
![]()
Use LEFT and RIGHT arrow keys to navigate between flashcards;
Use UP and DOWN arrow keys to flip the card;
H to show hint;
A reads text to speech;
197 Cards in this Set
- Front
- Back
|
What drives companies?
|
Every company is driven by quality, cost, and lead-time reduction goals.
|
|
|
Who (1) focused in meeting customer demand for a product variety and (2) was the first to use strategy and marketing in industry?
|
Alfred Sloan
|
|
|
Why is Six Sigma the goal?
|
For complex products and systems, six sigma is necessary to produce or perform defect-free more than 90% of the time.
|
|
|
PLT = WIP X ER
|
Little's Law: The more WIP (Work in Progress), the slower the PLT (Process Lead Time). Fixed Capacity (Exit Rate) X Increased People (WIP) = slower PLT |
|
|
Goal Statements
|
S (Specific) R (Realistic) |
|
|
Why measure?
|
(1) To gain knowledge about the problem, process, customer, or organization. (2) To establish the current performance level (baseline). (3) To determine priorities for action. |
|
|
What is a measure?
|
A measure is a qualified evaluation of characteristics and/or level of performance based on observable data.
|
|
|
Non-Value-Added
|
(1) Any activity that does not change the fit, form, or function of a product. (2) An activity the customer is not willing to pay for. *We focus on non-value activities for reduction or elimination in Six Sigma. |
|
|
RACI Chart
|
--It is a communication tool. (R) -- Who is Responsible (the doer)? (A) -- Who is Accountable (the Champion)? (C) -- Who is Consulted (before action is taken)? (I) -- Who is Informed (after action is taken)? |
|
|
Stratification
|
Important in data collection to ensure sample is representative of the true population.
|
|
|
LEAN
|
LEAN is a systematic approach (like DMAIC) of identifying and eliminating all non-value-added activities (wastes -- think TIM WOODS) for sustained improvements through a continuous-improvement philosophy.
|
|
|
COPQ
|
Cost of Poor Quality Quality could be how quickly we are getting a student through a curriculum. There are costs involved with poor quality. (Think about an iceberg--what you do not see that is beneath the water.) |
|
|
Control Chart
|
-A statistical tool used to see if a procedure is stable. -1st used in Measure Phase. -They provide a graphical picture of the process over time. -They help determine special cause & common cause components to variation. |
|
|
Champion
|
The Champion "owns" the project. He/She approves the membership of the Six Sigma Team. He/She kicks off the team launch and should be the person who invites the members to the team launch. |
|
|
DMAIC
|
Define Measure Analyze Improve Control |
|
|
DPMO
|
Defects Per Million Opportunities
|
|
|
Core Team Members
|
Think about who has the relevant skills (as the relate to gathering and organizing data) and contacts. Capabilities more relevant than just subject-matter expertise. |
|
|
DPU
|
Defects Per Unit
|
|
|
All work is a
|
Process
|
|
|
All processes have _________ and __________.
|
variation and waste
|
|
|
Variation causes ___________.
|
defects
|
|
|
FTY
|
First-Time Yield
|
|
|
Gate Review
|
A gate review closes out one DMAIC phase and opens the door (or gate) to the next. It could also be a stopping point for the DMAIC process. |
|
|
With what was Henry Ford most concerned?
|
Time. (Ex: Used black paint on cars because it dried faster.) |
|
|
What is the primary improvement vehicle in LEAN?
|
Kaizen
|
|
|
Kaizen
|
The focused application of LEAN tools to reduce muda (waste) to improve cost, quality, delivery, speed, flexibility, and responsiveness to internal & external customer needs. Implements "do now" solutions. |
|
|
Kaizen Events
|
They have a strong bias toward action. They focus on the immediate implementation of solutions. Decisions are often made on basic data and tribal knowledge. |
|
|
KPOV
|
Key Performance Output Variable (Another term for a metric) It is the "why." |
|
|
Mean
|
It is our optimal or desired level of performance (when looking at the mean of a process). It is also the average. |
|
|
Most dangerous waste?
|
The one that cannot be identified.
|
|
|
Muda
|
Waste
|
|
|
Mura
|
Unevenness (being "in the weeds"); huge spikes. Example: A very large order from a customer. |
|
|
PPM
|
Parts Per Million
|
|
|
SIPOC
|
Suppliers Input Process Step Output Customer A SIPOC is used in the Define Phase to help us understand the baseline condition before we move to the Measure Phase. |
|
|
TIM WOODS
|
TIM WOODS -- This helps us remember the eight wastes LEAN focuses on eliminating. T (transportation) I (inventory) M (movement) W (Waiting) O (Overproduction) O (Overprocessing) D (Defects/Rework) S (Subutilized Innovation/Crativity) |
|
|
Value-Added
|
An activity than changes the fit, form, or function of a product. The customer must be willing to pay for these activities. |
|
|
Standard Deviation
|
Standard deviation (sigma) is the average distance between the data points and the mean on a normal curve.
|
|
|
RTY
|
Rolled Throughput Yield The probability that a product will pass through the entire process without any rework and without any defects. |
|
|
TPS
|
Toyota Production System Formation of just-in-time (JIT) and LEAN production movements in the US and the world. |
|
|
Time Trap
|
The process step that takes the most amount of time. The time trap determines the exit rate. |
|
|
Time
|
The foundation of LEAN. We cannot get time back (once it is gone; it is gone).
|
|
|
Team Launch
|
--Part of the Define Phase --Charter is very important --This is where the team gets together for the first time. |
|
|
Range
|
The difference between the max and the mean. range = max-min |
|
|
Mode
|
The mode is the most frequently observed value in a data set.
|
|
|
Attribute Data
|
Has two main subsets: Binary Data and Discrete Data. No gauge is used to measure this type of data. Examples: Pass/Fail, Agree/Disagree, Win/Loss More subjective than continuous data. All of the values are positive integers. |
|
|
Process Z
|
Sigma Level
|
|
|
Continuous Data
|
Any data or number than you can use a gauge to measure. A set of numbers that can potentially take on any value from minus infinity to positive infinity including zero. Also called variable data. Money = continuous data. Continuous data can be divided into subsets. |
|
|
Y = f (Xi)
|
Y = to function of Xs X refers to the inputs that are associated with or create the output. |
|
|
stakeholders
|
Parties who affect or can be affected by an organization's actions.
|
|
|
Six Sigma
|
Six Sigma is where the mean of the process equals six standard deviations away from the customer expectations of the process. To determine the sigma value, we want to obtain the distance from the mean to the closest specification limit. |
|
|
Six Sigma Quality Level
|
Sigma describes variability. It is used to indicate how likely errors (defects) are to occur. Six Sigma quality level equates to 3.4 PPM defects (99.9997). |
|
|
Bell Curve
|
The Bell Curve is the VOP. The process determines the size ofthe Bell Curve. The customer determinesthe vertical lines (VOC). A defect is outside of the vertical lines (the upperand lower spec limits). Spec limits are based on customer wants/needs. |
|
|
Define Phase |
ProjectCharter
Validationof Voice of the Customer (Firstwe need to determine who our internal and external customers are as related toour project.) TeamLaunch Highlevel SIPOC |
|
|
CCR |
Critical Customer Requirement |
|
|
Boyle's Law |
Asthe pressure increases, the volume never changes. (The more space we have to“put stuff,” the more stuff we will store.) Boyle's law states that at constant temperature for a fixed mass, the absolute pressure and the volume of a gas are inversely proportional. (In other words, the product of absolute pressure and volume is always constant.) |
|
|
Central Tendancy |
Central Tendency is the property thatdata tends to group around a “center”point– This “center” may be themathematical average, most frequent observation, or data point in the center ofthe groupMedian, mean, andmode are common measures of central tendency. Central Tendency relates to accuracy. |
|
|
Bias |
The term given to the distance between theobserved average measurement and the true value, or “right” answer.
Bias isthe term given to the distance between the observed average measurement and thetrue value, or “right” answer. |
|
|
Precision |
The extent to which we are able to get the same data values when independent measurements are made on the same entity. |
|
|
Dr. Shewhart |
Dr. Shewhart of Bell Laboratories developed a theoryof variation that states there are two components to variation: Common Cause& Special Cause. He iscredited with the development of standard control chart based on +/- 3 standarddeviation limits to separate common cause variation from special causevariation. |
|
|
Control Charts for Continuous Data |
–I-MR,Xbar-R, Xbar-S |
|
|
Control Charts for Binomially Distributed Attribute Data |
P, NP |
|
|
Western Electric Rules |
They are a common method of identifying special cause variation. |
|
|
Normal Distribution |
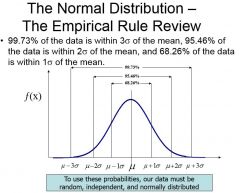
99.73% of the data is within three standard deviations of the mean; 95.46% within two SD; and 68.26% within one SD. |
|
|
Rational Subgrouping |
The process of selecting a subgroup based upon “logical” grouping criteria or statistical considerations |
|
|
Minitab Xbar-R |
Used with continuous data. Stat Control Charts Variable Charts for Subgroups Xbar-R Will need to enter variable(s) and subgroup size. |
|
|
Minitab P Chart |
Charts the proportion of defectives in each subgroup. Used with binomial attribute data. Stat Control Charts Attributes Charts P Will need to enter variable(s) and subgroup size. |
|
|
Special Cause Variation |
It is due to assignable causes that we canidentify. It is not random and changesover time. It is usually caused by an force acting upon the process from theoutside. This variation can be eliminated by eliminating the outside force acting on the process. Before reducing or eliminating, first clearly identify the source and root cause of the variation. |
|
|
Common Cause Variation |
It is random, stable, and consistent over time. It is an inherent part of the process itself and can only be changed bychanging the process itself. Sincemanagement owns and creates the process, it is up to management to change theprocess to minimize this variation. |
|
|
Tampering |
Tampering,or over-control, is when adjustments are constantly made to a process based onindividual measurements, test results, etc. |
|
|
Statistical Control |
Statistical control means a process iscontinuing to operate as expected, exhibiting only a stable, predictable amountof common cause variation. |
|
|
Descriptive Statistics |
The field of statistics that defines or characterizes a population based uponthe data points ( i.e., values) taken from that population. |
|
|
Parameters |
The terms used to describe the key characteristics of a population. |
|
|
N |
The letter N is used to describe the number of values in apopulation (the population size) when the population size is not infinite. |
|
|
Time Series Charts |
Time series charts showthe individual data values plotted in the sequential order in which they weregenerated–Run charts and Control Charts arecommonly used time series graphs |
|
|
Accuracy |
Theability to stay on target as measured by the mean |
|
|
Precision |
Consistencyof a process as measured by the standard deviation |
|
|
Right and Left Hand of Six Sigma
|
Central Tendency and Variability
|
|
|
Simple Time Series Plot
|
Used when we have only one variable and no groups. GRAPH TIME SERIES PLOT SIMPLE OK |
|
|
Charts Used with Continuous Data
|
I-MR and X-bar-R
|
|
|
Charts used with Binomial Attribute Data
|
P and NP Charts
|
|
|
Charts used with Discrete Attribute Data
|
C and U Charts
|
|
|
Process Capability
|
Quantifiable comparison of VOC (Spec Limits) and VOP (Control Limits) Most measures have some target value and acceptable limits of variation around the target. The extent to which the "expected" values fall within these limits determines how capable the process is of meeting its requirements. |
|
|
MINITAB CHEAT SHEET
|
http://beauchampsixsigma.com/wp-content/uploads/cheat-sheets.pdf.
|
|
|
CP/CPK PP/PPK |
(These are terms used to discussprocess capability. CP – example, thermostat on wall. Temp should be 70 +/- 2 degrees.Use thermostat to adjust on the fly. Doesn’t have to stop anything to make the adjustment. If he actually has to go to the AC unit andshut it down to make the adjustment, use CPK (The K = the constant. Thatrelates to the process shifting up to 1.5 standard deviations.). CP = short term (Collected data over a certain aperiod of time); PP = long term (What is the process capability over the longterm?) PP extrapolates from the current process to see what the long-termpredicted stability is. |
|
|
Control Limits
|
The horizontal lines above/below the mean on a control chart. They come from our historical data.
|
|
|
Measurement System Analysis
|
To validate measure system is sound. We want to make sure we do not have too much variation. Key part of the measure phase of the DMAIC Process. Helps us to verify and validate how much variance we have in our measurement system. (Exam Question) |
|
|
Why measure?
|
Establish the current process level (baseline). Determine priorities for action -- and whether or not to take action; substantiate the magnitude of the problem. To gain insight into potential causes of problems and changes in the process. Prevent problems and predict future performance. |
|
|
Measurement System
|
Helps us make a data-driven decision about a process and change the process. They help us to see processes clearly. |
|
|
FMEA
|
0 no control
1 remote 3 moderate 9 strong |
|
|
Discrimination or Resolution
|
Dependent upon how much accuracy we need. Ex: Olympic swimmer v. regular swimmer. We want our MS to be able to distinguish changes in 1/10 of range of the specification (LSL and USL). Ex: LSL = .80; USL = 1.20 Range = .40 (Acceptable Discrimination in this example is .04) Minitab (Number of Distinct Categories must be greater than four.) |
|
|
bias
|
It is an effect. Another term for this is error. The definition between the true value and the value captured by your measurement system. Linearity and stability can help offset bias. Calibrate. Can come from stability, linearity, or the person doing the process. |
|
|
stability
|
The stability of the gauge itself over time. (Ex: bathroom scale with spring) |
|
|
linearity
|
Ex: I know what my true weight is. I step on scale and it shows I am two pounds lighter than I actually am. (Always off by a set amount.) |
|
|
Calibration
|
To adjust linearity and stability.
|
|
|
Gauge (Gage) R & R
|
It is a controlled study. Used with continuous data. Addresses the Precision of the Process. (It gauges the precision of our measurement system.) Reproducibility (Takes more than one person). It is expressed as a percent. Over 30% is unacceptable. |
|
|
Repeatability |
The inherent variability of the measurement system. It is the variation that occurs when successive measurements are made under the same conditions: same part, same characteristic, same person, same instrument, same set-up, and same environmental conditions. (Ex: Jack measuring same highlighter ten times; he does not know he is measuring same highlighter.) Want to remove as much bias as possible.
|
|
|
MSA Standards for Gage R & R |
• The AutomotiveIndustry Action Group (AIAG) has two recognized MSA standards for Gage R&R: – Short Form – Five parts measured two times by two differentoperators – Long Form – Ten parts measured three time each by threedifferent operators • For good insightinto Gage R&R, go to www.aiag.org • Remember that theMeasurement System is acceptable if the Gage R&R variability is smallcompared to the Process or Study Variation seen. |
|
|
Distinct Categories
|
In a Gage R & R Report, the number of distinct categories should be greater than four. The distinct categories show the capability of the gauge to recognize differences.
|
|
|
Historical Standard Deviation |
An option in Gage R & R. It references the part we are making not our measurement system. |
|
|
Gage R & R Study (Crossed)
|
This is our go-to feature in Minitab. Gage R & R Study (Nested) is for doing a destruction test (where you can only measure something once). Ex. How much pressure can this part take before it breaks. |
|
|
Gauge Study
|
Stats Gauge Study Gauge R & R Study (Crossed) |
|
|
Analyze Phase
|
Purpose is to drill down to the root cause. Tip: Focus on the time trap. -identifythe few critical cause-and-effect relationships that explain most of therelationship between the key process input variables and the key process outputvariable. -Start with subjective analysis and move to statistical analysis. |
|
|
Cause and Effect Matrix
|
Used to develop an understanding of the greatest sources of variation within the process; pinpoints the critical few key process input variables (the X's) that must be addressed to improve the key process output variables. It is a matrix not a diagram. A subjective, stand-alone tool. Helps us get to root cause. Helps us determine what to focus on. |
|
|
Fishbone Diagram
|
Cause and Effect (Remember 6M -- helps us categorize) The 6 M’s are a mnemonic tool used primarily during the creation of a cause & effect diagram. The 6 M’s are: * Machines* Methods * Materials * Mother Nature * Manpower (People Power) * Measurements |
|
|
Five Whys
|
By repeatedly asking the question “Why” (five is a good rule of thumb), you can peel away the layers of symptoms which can lead to the root cause of a problem. (Can apply with fishbone diagram, or can stand alone.)
|
|
|
Brainstorming
|
Used to generate ideas.
|
|
|
FMEA
(It is a form but is also a process.) |
Failure Mode Effects Analysis (Started in our country in WWII, Manhattan Project. Used to develop atomic bomb and chemical warfare program.) Purpose is to head off Murphy's Law. (Severity, Occurrence, and Detection -- all assigned a value. RPM (Risk Priority Measure) -- the number we get when we multiply these three values. |
|
|
5S
|
1.1 Sort 1.2 Systematic Arrangement (Set in Order) 1.3 Shine (keeping things clean, painted, etc.) 1.4 Standardize (labels, signage, color-coding) 1.5 Sustain (Make part of our culture; keep in proper order) -- hardest "s" |
|
|
Pearson Correlation Value
|
In statistics, the Pearson product-moment correlation coefficient (sometimes referred to as the PPMCC or PCC or Pearson's r) is a measure of the linear correlation between two variables X and Y, giving a value between +1 and −1 inclusive, where 1 is total positive correlation, 0 is no correlation, and −1
|
|
|
Fitted Line Plot
|
The "fitted line" is the running average of the data points. We need to select "storage" when we run this and store (residuals and fits) so that we can later run a residual analysis. |
|
|
Adjusted R Sq
|
Adjusted R Sq is to R Sq as PP is to CP (More appropriate to use Adjusted R Sq) |
|
|
Simple Regression
|
Input/output = continuous.
Looks at the correlation between the X and the Y. Determines the slope. |
|
|
Residual Analysis
|
Once we run a regression analysis, we need to do a residual analysis just to verify the model we use is healthy.
|
|
|
Hypothesis Testing
|
Allows us to determine statistically whether or not a value is cause for alarm (or is simply due to random variation). Sample size is important. |
|
|
Alpha Risk (On Exam) |
.05 is representative. Type I error. "I've discovered something that really isn't here." Innocent man convicted. (producer risk) |
|
|
Beta Risk (On Exam) |
Type II error. "I've missed a significant effect." Guilty man set free. (Consumer risk) Reverse of Type-I error. |
|
|
ANOVA
|
Input is categorical and output is continuous. Testing more than two things with ANOVA. One factor with more than two levels. (Factor and Levels = terms that will be on the exam.) Checks variation within (ex. individual team), between (ex. between teams), and total. |
|
|
Sir Ronald Fisher
|
Developed the ANOVA mathematical model to help us determine which X's have more impact on the Y. |
|
|
Chi-Square Test for Association
(AKA -- Pearson Chi Square Test) |
Chi-squareTest for Association is a (non-parametric, therefore can be used fornominal data) test of statistical significance widely used bivariate tabularassociation analysis. Typically,the hypothesis is whether or not two different populations are different enough in some characteristic or aspect of their behavior based on two random samples.
|
|
|
Chi -Square Goodness-of-Fit Test
|
Chi-square Goodness-of-fit Test is used to test if anobserved distribution conforms to any particular distribution. Calculation ofthis goodness of fit test is by comparison of observed data with data expectedbased on the particular distribution.
|
|
|
Null Hypothesis (for Chi-square)
|
• Ho:The null hypotheses (P-Value > 0.05) means the populations have the sameproportions. |
|
|
Alternate Hypothesis (for Chi-square)
|
• Ha:The alternate hypotheses (P-Value <= 0.05) means the populations do NOThave the same proportions. |
|
|
FEMA |
Failure, Mode, Effects, Analysis RPN = P (probability of occurrence) X S (severity) X D (detection) The higher the number, the more risk. (FEMA is all about reducing risks.) |
|
|
FMECA (same as FEMA) |
Failure, Mode, Effects, Criticality, Analysis |
|
|
VOC (Voice of Customer) |
VOC = Voice of Customer = House of Quality = QFD (Quality Function Deployment) The VOC is the upper and lower spec limits. The VOC sets the expectations. |
|
|
Field of Quality |
Is about reducing risks. |
|
|
Gage R & R |
Tells us how effective our measurement system is. |
|
|
ONE-WAY ANOVA |
Type of hypothesis testing. With this type of test, we are really trying to decide is whether any of the means are different. It is a statistical method for comparing the means as of more than two levels when a single factor is varied. |
|
|
Pearson Correlation |
1 = perfect "positive" correlation 0 = no correlation -1 = perfect negative correlation |
|
|
Capacity |
Themaximum amount of service a process can deliver over a continuous period oftime6&qg=728&qi=1366&qj=728&qk=0&8#3B |
|
|
Constraint |
A time trap that is unable to produce at the exit rate required to meet customer demand (internal or external). |
|
|
Time Trap |
Anyprocess step that inserts delay time into a process. We are concerned with the time trap thatinjects the MOST delay.–Example: our property appraisers evaluate 120properties per day, all other process steps can process 145 applications per day |
|
|
Three Basic Principles of LEAN |
Takt, Flow, and Pull. |
|
|
Takt |
German word that means beat or count in music. It is the pace of customer demand. Determined by the customer. |
|
|
Takt Rate v. Time Time |
Reverse numerator and denominator in calculation. Takt Time (How often do we need a (one) student to be completing registration?) Takt Rate (X number of units -- multiple units) |
|
|
Flow |
|
|
|
Work Control Systems (aka CONWIP) |
WorkControl Systems limit the amount of Work-In-Process inventory in order to control Process Lead Time. |
|
|
PCE |
Process Cycle Efficiency (The percent of PLT that is value-added). It is a reference number. When we increase PCE, we compress PLT. PCE = VAT/PLT
|
|
|
Kanban |
A Japanese word, meaning “Sign”or “Signal” Kanban is considered to be a“Pull” Inventory Replenishment System. (Ex: Replenishing pork 'n beans in a supermarket) |
|
|
One-Piece Flow |
The ultimate goal in LEAN (Where you cannot go to one-piece flow, you kanban.) Kanban are replenishing signals. |
|
|
Pull System |
The PullSystem isa flexible and simple method of controlling/balancing the flow of resources.Eliminates waste of handling,storage, expediting, obsolescence, repair, rework, facilities, equipment,excess inventory (work-in-process and finished) |
|
|
Components of Good Pull System |
*Production based on actualconsumption * Better communication |
|
|
Two Types of Lead Times Related to Kanban |
Production Lead Time Transport Lead Time |
|
|
Transport Lead Time |
The amount of time it takes totransportthe part from the time the signal is sentto thetime the part is received. |
|
|
Production Lead Time |
The amount of time it takestoproduce the part fromthe time the signal is senttothe time the part is received. Production lead time includes the transportand production time of the part. |
|
|
Push System (MRP) |
Materials Requirements Planning --a complex computerized inventory production planningsystem with rules and procedures that supportpush, or batch manufacturing. |
|
|
Kanban Cards |
Triggers reorder. Includes the ordering information. Barcoding on kanban cards is GREAT. |
|
|
Gas Gauge Type Kanban Board |
Typically used for internally replenished inventory. |
|
|
Kanban Mailbox |
See-through. Should be able to see from a distance if there is a card in it. |
|
|
Safety Stock |
Covers us for variation in demand during lead time. (Unit of measure for usage, lead time, and safety stock need to be in the same units. Ex: all in hours) |
|
|
Kanban |
Better connects the supplier to a customer. (Should know how to calculate the Kanban quantity on the exam) |
|
|
What is SMED |
Single Minute Exchange of Design |
|
|
Benefits of SMED |
Lessadjustments means less chance for errors.•Elimination of trial processing reducesmaterial waste.•Preparation of operating conditions in advancehelps stabilize product quality.•Increased scheduling flexibility/ capacity.• Reduces the need for an on-hand inventory.• Smaller runs means less likelihood of largescale defects in inventory.•Improved service levels for our customers. |
|
|
Set-up Time (Change-over Time) |
“Set-up time is the total timebetween the lastgood piece off of a run and the first goodpieceoff of the next run.” |
|
|
Set-up Time (Classifications) |
Set-up time can be classified as:Internal Set-up:Those activities that must beperformed while themachine is idle or shut down. Example:Removing tooling, fixture, or die.External Set-up:Those activities that are performedwhile the machineis operating. Example:Preparing tooling for next set-up. |
|
|
SMED Methodology |
1. Observeand document the current set-up. 2. SeparateInternal and External elements.3. Developan Improvement Plan for each element. 4. Observeand document the new set-up process. 5. Standardizethe new set-up procedure.6. Celebrateyour success!!!! |
|
|
Seven Rules of SMED |
Rule 1 SMED begins and ends with the 5S’s.Rule 2 Convert Internal set-up to External, then improve the remaining Internaltime.Rule 3 Bolts are our enemies (if required,standardized).Rule 4 If you must use your hands, make sure yourfeet stay putRule 5 Don’t rely on special fine tuning skillsRule 6 Standards are not flexibleRule 7 Standardize all set-up procedures. |
|
|
TPM |
TPMis a common sense approach toproactively maintain equipment, eliminate unscheduled downtime, and improve thelevel of cooperation between Operations and Maintenance. |
|
|
Preventive Maintenance |
Preventive Maintenance is a timeor usage based method of maintainingequipment. Maintenance activities are performed on equipment based on definedtime and/or usage intervals to prevent equipment breakdowns from occurring.PreventiveMaintenance Schedules |
|
|
Predictive Maintenance |
Predictive Maintenance is a situation based method of maintainingequipment. Maintenance activities areperformed on equipment based on visible signals or diagnostic techniques toprevent equipment breakdowns from occurring.Vibration AnalysisLaser MeasuringUltrasoundGenerator TestingThermographyOil Analysis |
|
|
OEE |
Overall Equipment Effectiveness (OEE) isthe measure of the percent of time a piece of equipment is producing quality product at the designed rate. |
|
|
Evaluation Matrix |
A tool you could use to rate/evaluate alternative solutions.Helps you compare solutions. |
|
|
Pilot |
A pilot is a test of a proposed solution. This type of test has the following properties:–Performedon a small scale–Usedto evaluate both the solution and the implementation of the solution–Purposeis to make the full scale implementation more effective–Givesdata about expected results and exposes issues in the implementation plan. |
|
|
Tukey |
Tukey Pairwise Comparisons answer the question "which ones are statistically significantly different?" ANOVA shows if there is a difference, but Tukey actually shows where the difference is.
|
|
|
Measurement System |
Measurementsystems are like eyeglasses, when the lenses are incorrect, the vision isblurred. A measurement system allows usto “see” the process. When a measurement system is poor, we lose the ability tomake good decisions about how to improve the process. |
|
|
Measurement System (Purpose) |
Thepurpose of a measurement system is to better understand the sources ofvariation that can influence the results produced by the process underinvestigation. |
|
|
Measurement System (Common Key Measures) |
The two most common key measuresassociated with a measurement system are accuracy and precision. |
|
|
Kappa Value |
Kappa value should be at least .7 |
|
|
Accuracy |
The extent to which the average of the measurements deviate from the truevalue. In simple terms, it addresses the question, “On average, do I get the‘right’ answer?” If the answer is yes,then we say that the measurement system is accurate. If the answer is no, then we have aninaccurate measurement system. |
|
|
Bias |
the term given to the distance between the observed average measurement and thetrue value, or “right” answer |
|
|
Reputability |
Theinherent variability of the measurement system. It is the variation that occurs when successive measurements are madeunder the same conditions |
|
|
Severity, Occurrence, Detection |
Severity–Importanceof the effect on customer requirements.•Oftencan’t do anything about this. (1 not severe; 10 very severe) •Occurrence–Frequencywith which a given cause occurs and creates failure modes. (1 not likely; 10 very likely) •Detection–Theability of the current control scheme to detect or prevent a given cause. (1 likely to detect; 10 not very likely to detect) |
|
|
5S (Second S) |
Storage -- A place for everything. Everything in its place. It is all about having the visuals in place. |
|
|
ChiSquare |
A statistical test that is used to compare observed data with the data we would expect to obtain. Were the differences between the observed and expected the result of chance or some other factor? |
|
|
Residual Analysis |
Once we run a regression analysis, we need to do a residual analysis to verify the model we used is healthy. |
|
|
Pearson Correlation Value |
Helps quantify the relationship of X to Y. 0 = no correlation. -1 = perfect negative correlation. |
|
|
R Square |
Based on data set you gather. |
|
|
Adjusted R Square |
Extrapolates from R Square; more appropriate to use than R Square. |
|
|
Predictor Interval |
Looks at one data point at a time. It is a stronger data tool to use for prediction. |
|
|
Residual Plots for Y |
The dots are the residuals -- not the data points.If all the dots follow closely to the line, there is a normal dist. of the residuals. (Versus fits) -- scattered = good; do not want to see a pattern here. |
|
|
Hypothesis Testing |
Things are not always as they appear. |
|
|
Box Plot (Interpreting) |
The cross line is the median. The plus with the circle is where the mean is. |
|
|
P Value |
If it is less than .05, we can reject the null. (Remember: If it is low, the null must go. If it is high, we keep the guy.) |
|
|
Factors & Levels (On Exam) |
With one-way ANOVA, still only looking at one factor (like teams) but may have multiple levels (the different teams). Inputs (team one and team two -- categorical) outputs (time -- continuous). Follow ANOVA with a 2-sample t-test. |
|
|
Alpha Risk |
This is also known as the PRODUCER'S RISK. It is a Type-I error. (.05). Calling something that is good bad. Example: convicting an innocent man. |
|
|
Beta Risk |
This is also known as the CONSUMER'S RISK. It is a Type-II error. (.95). Calling something that is bad good. Example: Setting a guilty man free. |
|
|
The zero plane1
|
In Tukey's test. If the horizontals cross the vertical (0), there is no statistically significant difference. In the carpet sample exercise, there is a statistically significant difference between 4 and 2.
|
|
|
Chi Square (Hypotheses)
|
• Ho:The null hypotheses (P-Value > 0.05) means the populations have the sameproportions. • Ha:The alternate hypotheses (P-Value <= 0.05) means the populations do NOThave the same proportions. |
|
|
Chi Square Critical Value
|
3.841 (If it is lower than this, we accept the null)? Ask Kris.
|
|
|
Statistics
|
(LB) -- They are associated with a sample. |
|
|
Systems
|
Usually made of multiple processes.
|
|
|
Statistical Control
|
Stable and Predictable
|
|
|
Discrete Distributions
|
Binomial (Binary): Data that is used to track defective items. Example: Students who fail. Poisson: French Word. Used when looking at defects. Can have several defects related to one defective item. Example: commonalities among students who failed. Hypogeometric: Sampling w/o replacement. |
|
|
Inferential Statistics
|
Inferring something from a larger sample group based on a sample.
|
|
|
The Field of Quality
|
Is involved with minimizing risk.
|
|
|
Robust Design |
Designed so that it is almost immune to noise. Taguchi. Minimizes the impact noise has on an output. Noise factors: hold on account, financial issues, transportation issues, life issues.
|
|
|
Calculated P Value
|
Regardless of the test in Minitab, we will get a calculated P value. If the "actual P" is less than .05 (the reference P), then we can reject the null.
P Values are really about probability. |