![]()
![]()
![]()
Use LEFT and RIGHT arrow keys to navigate between flashcards;
Use UP and DOWN arrow keys to flip the card;
H to show hint;
A reads text to speech;
22 Cards in this Set
- Front
- Back
- 3rd side (hint)
|
Biological species concept (BSC; Mayr, 1942) |
A species consists of populations of organisms that can reproduce with one another and that at reproductively isolated from other such populations |
|
|
|
Problems of BSC |
• often impossible to find out if two individuals can reproduce • some clearly distinct species can reproduce (e.g. in captivity)- although offspring may have health problems and/or be sterile • can’t apply to fossil species |
|
|
|
Defining species |
• Difficult to define species for prokaryotes ( Archaea and Bacteria) • Bacterial species normally defined based on overall similarly of DNA- 97% similarity means they are the same species |
|
|
|
Eukaryotes |
Organisms with complex cells (includes multicellular organisms- e.g. plants, animals and fungi) Estimated between 2 and 20 million eukaryotic species < 0.1% of total species Estimated that >99.9% of all species that lived are extinct |
|
|
|
Taxonomy |
Branch of biology concerned with the identification, description, naming (nomenclature) and classification of organisms |
|
|
|
Systematics or classification |
Organisation of organisms into groups according to some ‘system’ |
|
|
|
Phylogenetics |
Branch of biology studying evolutionary relationships between organisms |
|
|
|
Carl Linné (or Leinnaeus): 1707-1778 - Father of modern taxonomy |
“Systemae Naturae” (1758): • First classification of plant and animal species, foundation of modern taxonomy • introduction of binomial nomenclature - “Binomial” means two names - “nomenclature” refers to systems of naming things • two part name: - Genus name first (capitalised) - Species name second (not capitalised) - Full name should be in italics or underlines |
|
|
|
7 main ranks of Linnaean classification hierarchy |
Kingdom Phylum Class Order Family Genus Species - Additional rank has been proposed above the level of Kingdom: Domain - Other ranks can be used~ e.g. Superfamily (above Family) and Subgenus (above Species) |
King Phillip Cried Our “For Goodness Sakes!” |
|
|
Linnaean taxonomic ranks are arbitrary |
•One family of mammals is not the “same thing” as another family of mammals, or a family of fish, or a family of insects... • Shouldn’t be compared directly |
|
|
|
Phylogenetics |
Study of the evolutionary relationships (phylogeny) of organisms - Charles Darwin is the central figure in the development of the modern understanding of evolution by natural selection |
|
|
|
Outcomes of evolutionary process |
Adaptation- Organisms change through time and become better suited to their environment Speciation- One species gives rise to two or more differently adapted species Extinction- Some species die out completely |
|
|
|
Tree of Life |
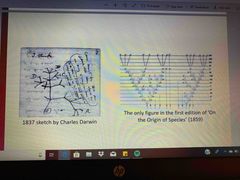
• Linnaeus proposed his system of classification before evolution was accepted- based on similarity • Darwinian evolution and the concept of the Tree of Life provides an underlying explanatory framework for Linnaean classification - Species in the same genus are more closely related to each other than they are to species in a different genus - Genera in the same family are more closely related than genera in a different family |
|
|
|
Phylogeny |
A lot of modern biological research is devoted to working out the Tree of Life |
|
|
|
Why measure Biodiversity? |
• To identify biodiversity “hotspots” • To determine the “health” of a particular ecosystem • To try to identify/understand processes that generate biodiversity |
|
|
|
How do we measure biodiversity? |
• An obvious measurement is species diversity of a particular area/ environment • Two different aspects of species diversity - Species richness= how many species are present - Species evenness= relative abundance of the species present- are there relatively equal numbers of individuals of different species, or does just one it a few species dominate? • Overall we say species diversity is highest in environments with lots of species and where species occur are relatively even numbers |
|
|
|
Compare species diversity sites |
• To meaningfully compare species diversity between sites, we need to standardise our sampling effort - Need then make sure any different aren’t due to differences in sampling efforts • Some aspects of sampling that can be standardised: - Area samples - Time spent sampling - Number of people sampling |
|
|
|
Standardising for area |
• Quadrat= standardised area (usually but not always square) - can be any size, but 1cm2 is common - use equal numbers of quadrats between sites - should expect to find greater overall species richness with more quadrats - usually, quadrats should be places randomly within site • Transects= a like or path along which samples are taken - can be any length - sample at fixed points or randomly along the transect - use equal numbers of transects of same length between sites - usually, transects should be places randomly in site
|
|
|
|
Standardising for time and people |
• In case of surveys, you can calculate “person hours” - = numbed of hours worked per persons x number of people • In case of trapping, you can calculate “trap nights” - = numbed of traps x number of nights traps were set |
|
|
|
Voss et al. (2001) |
• Mammal sampling - 202 sampling days - ~2500 person hours of day hunting - 590 person hours of night hunting - 5960 trap nights of ground-level trapping - 2004 trap nights of tree-level trapping • Found total of 50 non-flying mammal species • Didn’t fund 14 species known to be present in the area based on previous studies and interview with locals |
|
|
|
Why might species not be sampled? |
• Elusive • Present in very low numbers and/ or area that weren’t sampled • only present at certain times of the year cryptic ( hard to distinguish from other species) • Problems with sampling technique (e.g. wrong bait in traps) • “Luck”/ randomness |
|
|
|
Species accumulation curves |
• Total numbed of species found increased as sampling effort increased • Graph starts to level off - common species found repeatedly - takes much more effort to find the rarest species • Line never becomes flat (= all species found) - but we can estimate mathematically (with some error margin) when the line would become flat = total number of species |
|