![]()
![]()
![]()
Use LEFT and RIGHT arrow keys to navigate between flashcards;
Use UP and DOWN arrow keys to flip the card;
H to show hint;
A reads text to speech;
69 Cards in this Set
- Front
- Back
|
Core-Periphery Model (map scale and projections theories and models) |
This model represents how economic, cultural, or political power is distributed between dominant core regions and more marginal dependent regions, or likewise peripheral and semi-peripheral regions. (map scale is the ratio of the distance on a map to the distance on the earth.Map projections show earth's surface as a flat surface. Three Projection model are conic, cylindrical, and planar.) |
|
|
Peters Projection |
It is a model where the area is accurate (equal area map) but it has a distorted shape. The direction, distance, and shape are wrong. |
|
|
Mercator Projection |
The direction is accurate. The shape is consistent but a little distorted. The land masses at higher altitudes near the poles appear to have larger land masses. Rectangular map. |
|
|
Fuller Projection |
The area and shape are accurate, but the direction is totally inaccurate. |
|
|
Goodes-Homosline Projection |
The area is pretty accurate, but the oceans are divided which causes the distance to be distorted. |
|
|
Robinson Project |
It equally distorts all four map aspects. This includes shape, area, distance, and direction. Land appears smaller than actuality, but it is good for information regarding oceans. |
|
|
Scale |
It is the relationship between the point of the earth that is being studied and the earth as a whole. |
|
|
Isoline Map |
There are line which connect points of equal importance and show a continuous distribution. |
|
|
Cartogram |
It is not a real map. The size on the map is equal to the value. It is used mostly for statistics and information. |
|
|
Dot Density Map |
It is a map that shows frequencies per dots. |
|
|
Proportional Symbol Map |
This is a map with symbols in which their sizes are representative of the values. |
|
|
Chloropleth map |
It is a map that has information represented by colors and shading. |
|
|
Malthus Population Catastrophe |
It is a principal of population written by Malthus which states that the world's population is growing faster that the earth's food supply. He mentions that population grows geometrically where as food supply grows arithmetically. |
|
|
Neo-Malthusians |
These are people who believe in two aspects: one that the gap between population and resources is wider in some countries because of rapid population growth in LDC's, and two that the population is growing faster than other resources such as energy and food. |
|
|
Boserup's Hypothesis of Population (anti-Malthusian) |
He argued against Malthus and said that population growth was the solution to it's own problem because the more people the more ideas, the more production from subsistence farming, and he believed people should work on survival's behalf. |
|
|
Population Pyramid Components |
This type of pyramid displays a country's age and gender groups. The length of the bars represent the percentage of people in that category. From this the dependency ratio and the sex ratio can be calculated. |
|
|
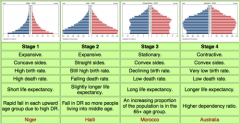
Population pyramid Example Shapes |
There are 4 basic shapes for the population pyramid: Triangle, rectangle with a bulge in the middle, rectangular, and upside down triangle. Each shape corresponds to a stage in the DTM. |
|
|
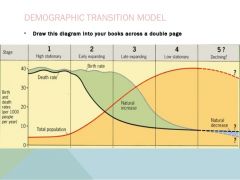
Demographic Transition Model (DTM) |
This is a process that countries go through which regards population levels. There are four stages: low growth, high growth, moderate growth, and decline. |
|
|
DTM Visual |
|
|
|
Epidemiologic Transition Model |
This focuses on the cause of death in each stage of the DTM. Stages 1 and 2 are usually infections, parasites, animal attacks, and human combat. Stages 3 and four it is usually degenerative, poverty, and human made diseases. |
|
|
ETM Visual |
|
|
|
Gravity Model of Spatial Interaction |
This model predicts the flow of people, objects , and services within a geographic space. It predicts the ideal location of a service assessed by the number of people around that space. It is inversely related to the distance people travel to access service. It can also figure out the pull each city has on people. Larger places attract more people, and smaller places less people. |
|
|
Ravenstein's Laws of Migration |
11 laws that determined why people would migrate and which people would do it. Most migrants travel short distances within their country. If people are migrating far they usually migrate to a big city. Individuals migrate more than families. Rural populations are more likely to go to urban ones. Most migrants are young men seeking work. |
|
|
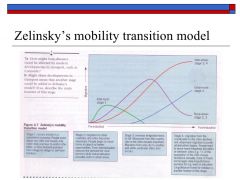
Zelinsky Model of Migration Transition |
It is based of off the DTM. It also focuses on migration patterns. There are three stages: one, seasonal and cyclic movement, two, immigration to urban areas, three, internal migration also known as sub urbanization. |
|
|
MTM Visual |
|
|
|
Indo-European Language |
This is the worlds largest language family; it includes the Germanic, Romance, Balto-Slavic, and Indo-Iranian languages. |
|
|
I-E Language Diffusion Theories (Agriculture, Conquest) |
This theory says that the Indo-European languages came from the Proto-Indo-European langues which were used prior to them. There are two theories of diffusion. The agricultural theory says that speakers lived in Anatolia and Turkey and diffused west with agricultural innovations. The second theory says that the Kurgans of Russia were nomadic herders who migrated ad conquered the lands of where their prey was. |
|
|
Domino Theory |
This was a foreign political policy which stated that if communism was established in an area the areas around it would also become communist and this would set off a domino effect. |
|
|
Heartland Theory |
Mackinder believed that Eurasian landmass was the center of the world and that since Russia owned a big chunk of that land mass they should have more political power and more power towards world resources. |
|
|
Rimland Theory |
This is the opposite of the heartland theory. It is believed that the land and oceans surrounding the Eurasian landmass is the key to power and resources. |
|
|
Rank Size Rule |
His describes the connection of a city's size and location on the urban hierarchy. The nth largest city's population is 1/n the size of the largest city population. |
|
|
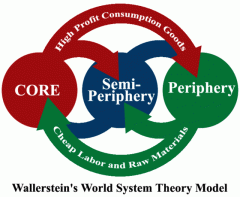
World Systems Theory (Wallerstein) |
It is a theory that states that core regions make decisions for the world, semi-periphery make decisions for themselves and the areas around them, periphery regions have little say in anything and are controlled by the other two. |
|
|
WST Visual |
|
|
|
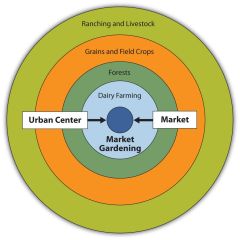
von Thünen's Agricultural Model |
This model accounted for location and it was based of of the concentric model. There are rings around the marketplace which is the center city. Market and gardening were next to the center, then forestry, and then field crops, and last animal grazing land. There were a lot of assumptions: one mode of transportation, one market, flat, uniform, no barriers. Two factors contributing to location were cost of rent and cost of transportation. |
|
|
von Thunen visual |
|
|
|
First Agricultural Revolution |
This was when animal and plant domestication was established. Birthrates and thus population both increased. Social differences were conforming. |
|
|
Second Agricultural Revolution |
It was in Europe in the 1600's before the industrial revolution began. New inventions allowed for greater food production. The enclosed system became used, and experimentation of new methods began. |
|
|
Third Agricultural Revolution |
It was during the 1960's and 1970's. The regions gained the ability to provide for everyone. There were more crops, more fertilizers, and a lot more technology. |
|
|
Liberal Models of Development (self-sufficiency / international trade) |
After and during the great depression, a lot of countries executed self sufficiency. The country would depend on its own production and population to suffice and ameliorate the economy. There would be a lot less imports, a lot more domestic trades. Other countries executed international trade where they depended on other countries for products and they try to make their economies better by exporting more than they import. |
|
|
Structuralist Model of Development (dependency theory) |
This states that MDC's will help an LDC financially and give debt relief. however the LDC must sign a contract which outlines the economic goals, strategies, and financing requirements for that LDC. |
|
|
New International Division of Labor |
It is a transfer of job types where people of low-skill and low-wages are transferred from MDCs to LDCs. |
|
|
Rostow's Stages of Growth (Modernization Model) |
This model has five stages that focus on the development stages withing a nation. 1: Traditional Society 2: Pre-Take-off Stage 3: Take-off Stage 4:Drive to Maturity 5:High Mass Consumption |
|
|
Fordism |
This is a concept of mass production focused on specialization. |
|
|
Post-Fordism |
|
|
|
Location Interdependence Theory (Hotelling) |
It is a model that states that industry will naturally maximize profits as much as possible by locating businesses of related industries close to each other. This is the main point of locational interdependence. The theory is based off of locational interdependence and spatial monopoly. An industry will locate close to its competitors, so it will be able to gain some of their consumers and thus they will make a profit. This model also considers production costs and the size of the market before choosing a location. The theory also assumes that production cost, product selection, and consumer demand are equal in all aspects. |
|
|
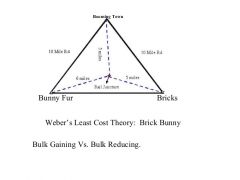
Weber Model of Industrial Location (Least Cost Theory) |
This theory determined the best location for an industry according to transportation, labor costs, and agglomeration. The idea looking at each of these three aspects was to minimize costs and maximize profits in that certain location. |
|
|
Weber Visual |
|
|
|
Profit Maximization (Losch’s Zone of Maximization) |
Instead of relying on one specific location or point of profit, an industry should determine a region or optimal locations that would allow for maximizing profits as much as possible. This theory also considers consumer demand and production costs while accounting for the substitution principle. In Lösch's theory, there are assumptions of an isotropic plain, rational consumers, evenly distributed population, uniform demand, consumer payments of shipping costs, and the possibility of new production plants into the marke |
|
|
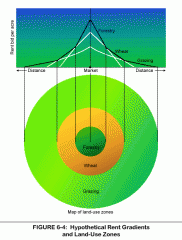
Bid-Rent Theory (Land Rent) |
This theory states that as one moves away from the CBD, land value decreases. Also, Population density declines as distance increases. It has led to vertical expansion. This theory also explains why commerce is located in the CBD and why residential areas,industries, and manufacturing plants are willing to move away from the CBD. |
|
|
Bid-Rent Visual |
|
|
|
Borchert’s Model of Urban Evolution |
This model shows urbanization in four distinct periods in Us history. Each time period represents the transportation that dominated during its time. 1: Sail Wagon Era with waterways and ports. 2: Iron Horse era with rivers and canals. 3: Steel Rail era with industrialization booming. 4: Auto-Air Amenity era with car and air travel and highways and suburbs |
|
|
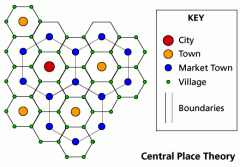
Central Place Theory (Christaller) |
This theory states that the size of a city is related to the surrounding population and how many it can serve. It assumes land is flat and transportation is equally distributed. |
|
|
CPT Visual |
|
|
|
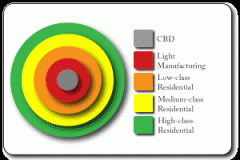
Concentric Circle (Burgess) |
This is a model of a city where there is a CBD in the center and there are rings that encircle it. Everything is connected with transportation from the CBD. Transportation is difficult. There is a positive correlation between distance from the CBD and money.Circles from center to outside: CBD, Zone of Transition, Working Class Zone, Residential Zone, Commuter Zone. |
|
|
Concentric Model Visual |
|
|
|
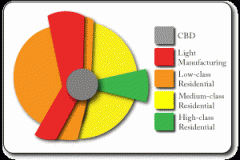
Sector Model (Hoyt) |
The growth of a city is based on certain sectors. The sectors are uneven and they are attached to the CBD. They grow according to the benefits of the area. Transportation is more accessible than that of the concentric model. The sectors most used in this model include the Lower Class Residential, Middle Class Residential, High Class Residential, and Factories/Industry. The Lower Class and Middle Class sectors are larger than the other sectors. |
|
|
Sector Model Visual |
|
|
|
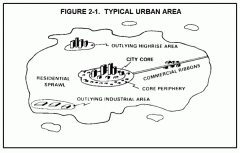
Peripheral Model |
Model in which a beltway joins together the suburbs and business areas around a city. Edge cities are also part of the beltway. This includes manufacturing and retail nodes. The benefits of this model are less congestion and less crime. But the cons are more segregation and urban sprawl. |
|
|
Peripheral Model Visual |
|
|
|
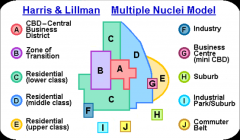
Multiple-Nuclei Model |
This model is based on several different nodes of influence in addition to the CBD. Some nodes will attract people and industry while others will repulse the same things. Nodes: CBD, Light manufacturing, low-class, middle-class high-class housing, residential suburbs, heavy manufacturing, outlying business districts. |
|
|
Multiple-Nuclei Visual |
|
|
|
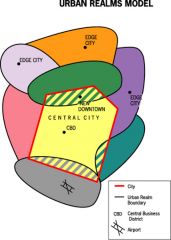
Urban Realms Model |
This model was made to explain the increase in suburbanization. This was the opposite direction from urbanization and the reason this model suggests is that cars and transportation became a lot more easy and available, so since people could now easily commute to work they moved into suburbs where the lifestyle was a lot more relaxed. |
|
|
Urban Realms Visual |
|
|
|
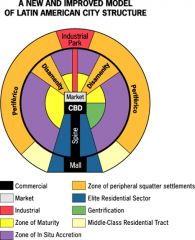
Latin American Cities Model |
|
|
|
Latin American Cities Visual |
|
|
|
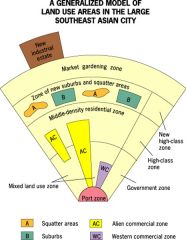
SE Asian Cities Model |
This model also refers to a theory where everything encircles the center of the city. This model centers around the colonial port zone. There are clusters of CBDs, large commercial zones around the colonial port, government zones, alien-commercial zones, Western-commercial zones; and mixed land-use zones. |
|
|
SE Asian Cities Visual |
|
|
|
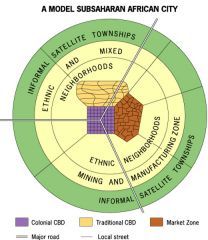
African Cities Model |
In this model there are usually 3 CBDs: colonial CBD, period market zone, and transitional business CBD. There is a vertical structure in the colonial CBD, one-story buildings in transitional CBD, and informal stands for the period market CBD. There are ethnic and mixed neighborhoods because of mining and manufacturing zones. |
|
|
African Cities Visual |
|