![]()
![]()
![]()
Use LEFT and RIGHT arrow keys to navigate between flashcards;
Use UP and DOWN arrow keys to flip the card;
H to show hint;
A reads text to speech;
19 Cards in this Set
- Front
- Back
|
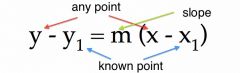
Point-Slope Form |
|
|
|
Parallel Lines have slopes that are: |
Equal |
|
|
Perpendicular Lines have slopes that are: |
Negative reciprocals |
|
|
Scatter Plot |
A graph that shows the relationship between two data sets. |
|
|
Correlation |
a relationship between data sets. |
|
|
Positive Correlation |
As x increases, y increases. |
|
|
Negative Correlation |
As x increases, y decreases. |
|
|
No Correlation |
The points on the scatter plot show no pattern. |
|
|
Line of Fit |
A line drawn on a scatter plot that is close to most of the data points. |
|
|
Residual |
the difference of the y-value of a data point and the corresponding y-value found using the line of fit. |
|
|
When a residual plot shows a pattern, that means that: |
it is not a good fit for the data |
|
|
When a residual plot does not show a pattern, that means that: |
it is a good fit for the data |
|
|
correlation coefficient |
The value that tells whether the correlation is positive or negative and how closely the equation models the data. The closer r is to 1 or -1, the stronger the correlation is. |
|
|
Line of BEST Fit |
The most perfect line of fit that can be created for the data. You need to do this on your calculator. |
|
|
Steps to Finding Line of Best Fit and Correlation Coefficient: |
1. Enter the data from the table into two lists (x in L1 and y in L2) 2. Turn your diagnostic on. 3. Use the linear regression feature. The values of the equation can be rounded to create the line. 4. r is the correlation coefficient. |
|
|
Arithmetic Sequence |
a sequence where there is a common difference. |
|
|
Explicit Rule for an Arithmetic Sequence |
|
|
|
Piecewise Function |
A function defined by two or more equations, each with a different "piece" of the domain. |
|
|
Step Function |
A piecewise function defined by a constant value over a part of each domain. |