![]()
![]()
![]()
Use LEFT and RIGHT arrow keys to navigate between flashcards;
Use UP and DOWN arrow keys to flip the card;
H to show hint;
A reads text to speech;
62 Cards in this Set
- Front
- Back
|
What is the bubbling-phase for? Why exit if you´re already in there? |
To inform other events when this one event is over. |
|
|
What kind of scales are there? |
There´s time scales, ordinal scales (for strings) and quantitative (for numbers) scales. |
|
|
How to connect to a the most simple webserver? |
python -m SimpleHTTPServer |
|
|
What can I do with .data()? |
I can return the current data but also attach data to DOM-Elements |
|
|
What´s the difference between d3.select and d3.selectAll |
d3.select is only selecting the first element. |
|
|
What does an event listener look like? |
el.addEventListener('click',sayHello,false); |
|
|
What is the third parameter in an eventlistener doing? |
The third parameter “false” is to define if the event should be called on the capture or on the bubble phase of the event. |
|
|
How do you make a transition follow another transition? |
.transition().each(“end”, function() { d3.select(this) .transition() .attr(“height”,”40”) .attr(“width”,”40”) .duration(3000);
}); |
|
|
How do you get the current x and y position? |
d3.select(“rect”) .on(“mouseover”, function(d,i) { var currentElementX = d.x; var currentElementY = d.y;
} |
|
|
How do you remove an element with an Id? |
d3.select(“#RemoveMe”).remove() |
|
|
How can you affect another element on a mouse-move? |
d3.selectAll(“rect) .on(“mouseover, function(d, i){function(){ d3.selectAll(“rect”) .attr(“opacity”,”0.25”); d3.select(this) .attr(“opacity”, “1”);
}); |
|
|
How to let input elements decide what´s being visualised? |
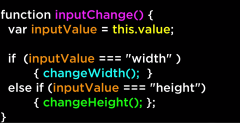
|
|
|
How to pass data to stack layout? |
var stack = d3.layout.stack(); stack(layers); |
|
|
What is the stack-layout function doing? |
The function adds a new key-value-pair calculating the new y0-value where the bar will be positioned. |
|
|
Where should the data be? |
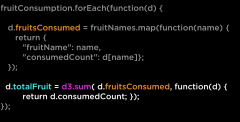
The data should never be in the key but only in the value. So sometimes we need to rearrange for example like that: |
|
|
How to timeout an event? |
var timeout = setTimeout(function() { d3.select(“input[value=\”grouped\”]”).property(“checked”,true).each(change);
}, 3000); |
|
|
What is the j variable? |
- it´s a variable that d3 offered us to show the index of the nested data we are in
- it holds the index of the parent data element |
|
|
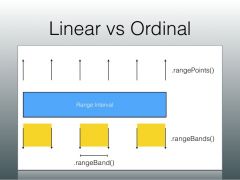
What´s the difference between .rangePoints() and .rangeBands()? |
|
|
|
How to define a scale? |
d3.scale.linear().domain([0,400]).range([0,200]) |
|
|
What does a function to create test data look like? |
function bumpLayer(n, o) { function bump(a) { var x = 1 / (.1 + Math.random()), y = 2 * Math.random() - .5, z = 10 / (.1 + Math.random()); for (var i = 0; i < n; i++) { var w = (i / n - y) * z; a[i] += x * Math.exp(-w * w); } } var a = [], i; for (i = 0; i < n; ++i) a[i] = o + o * Math.random(); for (i = 0; i < 5; ++i) bump(a); return a.map(function(d, i) { return {x: i, y: Math.max(0, d)}; }); } |
|
|
What is the general d3-pattern look like? |
var circles = svg.selectAll(“circle”) .data(data)
.enter().append(“circle”); |
|
|
What is .exit() doing? |
returns the elements without data, in case there wash´t enough |
|
|
What is .enter() doing? |
creates placeholders for the elements that will get elements appended to in the future => they are empty selections (if the .enter() is undefined the elements needed are already created) |
|
|
How do you update data? |
To update you need to add the new data and then attribute the new data to create the elements |
|
|
How do you remove elements for which no data exists? |
d3.selection.data(…).exit().remove(); |
|
|
What type are selections? |
Selections are arrays, so the data that gets added to them should be arranged in arrays, too. |
|
|
What´s a key-function for? |
To keep objects constant even when they are updated it´s important, that they have unique identifiers for example if the datasets have different amounts of elements or the order changes
d3.selection.data(x, function(d,i){…}); |
|
|
Why do you have to do clearInterval(id);? |
Because each time you set and interval and ID is being returned. |
|
|
How do you get the currentTime? |
var currentTime = new Date(); |
|
|
How do you get the minutes? |
var currentTime = new Date(); var minutes = currentTime.getMinutes(); |
|
|
What type is the scale? |
The linear scale is both and object and a function, because the domain and range are methods of the object/ the axis: (meaning we can redefine the scale object, when the data is changing). |
|
|
How to upate an axis? |
After changing a scale you also have to pass in the new scale to the axis and then call the axis again. |
|
|
How to transtion between an old and a new axis? |
d3.select(“#x-axis”) .transition() .call(myXAxis);
|
|
|
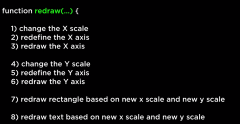
What are the steps to redraw graph? |
|
|
|
How to append a button with d3.js |
var originalButton = d3.select("body").append("input").attr("type", "button").attr("value", "original").attr("id", "button_original")
.style("font-size", "2em"); |
|
|
What are you affecting to allow zoom-behavior? |
To allow zoom behaviour you change the input-domain to show another range of values. Meaning if we zoom in it will have influence on the axis function and has to be called again.
|
|
|
What is the zoom function doing exactly? |
var zoom = d3.behavior.zoom().x(xAxisScale).y(yAxisScale)
Build-in function takes care of changes the axis scale |
|
|
What is zoom.scale([scale]) returning? |
Will return the zoom which is neccesairy to redraw the chart (by default it´s set to 1). |
|
|
How can you limit the zoom? |
zoom.scaleExtent([min,max]) |
|
|
Where does the zoombehavior get called? |
The zoom behaviour gets called on the innerDrawingspace. |
|
|
How you make empty space zoomable? |
Fill it with a white rectangle. |
|
|
Whats the difference between an initial drawing and the redrawing regarding a zoom? |
When you redraw you only set the attributes again.Example: circles.attr("cx", function(d, i) { return xAxisScale(d.cx); }).attr("cy", function(d, i) { return yAxisScale(d.cy); }).attr("r", function(d, i) { return (d.radius * scaleMultiplier); }); Initial drawing looks like that: var circle = innerSpace.selectAll("circle").data(data).enter().append("circle").attr("cx", function(d) { return xAxisScale(d.cx); }).attr("cy", function(d) { return yAxisScale(d.cy); }).attr("r", function(d) { return d.radius; })
.style("fill", "green"); |
|
|
Whats the difference between a line chart and a area chart regarding the code? |
Area chart has an additional y0-value. |
|
|
Whats the difference between a line chart and a area chart regarding the code? |
There are almost being drawn the same but the area chart has an aditional y value for where the area starts being filled: |
|
|
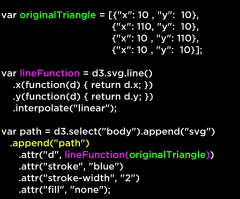
How to first construct a paths and then append it? |
|
|
|
What is d3.event.translate? |
A vector with to values.var panVector = d3.event.translate;var panX = panVector[0];
var panY = panVector[1]; |
|
|
What if you want to zoom into an svg-path that is already drawn? |
You can calculate the multiplication-factor using the scale.
d3.select("path") .attr("transform", "translate(" + panVector + ") scale(" + scaleMultiplier + ")"); |
|
|
How to append a custom svg???? (finally) |
innerSpace.append("path").attr("d", "M10 315 L 110 215 A 30 50 0 0 1 162.55 162.45 L 172.55 152.45 A 30 50 -45 0 1 215.1 109.9 L 315 10").attr("stroke", "black").attr("fill", "green").attr("stroke-width", "2")
.attr("fill-opacity", "0.5");
- before optimise SVG with svgo filename in Terminal
|
|
|
How to you set a color range for example? |
var colorScale= d3.scale.linear().domain([0,31]).range(["white","blue"]);
|
|
|
How to arrange elements? |
.attr("transform", function(d, i) { return "translate(0," + i * 20 + ")"; });
|
|
|
What does a barchart look like when I do that on the y scale? .rangeRoundBands([0, height]); |
The bars are touching.
|
|
|
To get an array of keys from Json you can do? |
var intelligence = d3.keys(data[0]) .filter(function(key){ return key !== "time"; })
data[0] because it´s enough to get the keys from the first object. |
|
|
Where to the tickvalues normally come from? |
d3.svg.axis() creates them by default! |
|
|
What´s .rangeRoundBands() and .rangeBand doing? Difference? |
With .rangeRoundBands your set the range within the single bands will be created. With .rangeBand you create one band! |
|
|
What is d3.extent(data ,function(d){ return d.date; } doing? |
It´s making a range of the minimum and maximum values of the data. |
|
|
How do yo limit a drag-movement? |
d.x = Math.max(smallside, Math.min(width - smallside, d3.event.x)) d.y = Math.max(bigside, Math.min(height - bigside, d3.event.y)) |
|
|
.enter, .exit are what? |
Selections |
|
|
If you want to have an .exit()-selection, where to do it? |
On the same element where you add the data. var addNew = svg.selectAll(".layer").data(slicedData)exit(); |
|
|
What is a closure? |
when an inner function is made accessible from an outer function. function add(value1) { return function doAdd(value2) { return value1 + value2; };}var increment = add(1);var foo = increment(2);// foo equals 3 |
|
|
async> |
This causes the following script to load and execute already while this one might not be done yet. |
|
|
What is JSONP doing? |
It´s a return a callback from a foreign server, you can only get the complete one and not stream. The callback get attached as a script-tag, that´s why it´s risky. |
|
|
What´s the difference between .call and .apply? |
The difference is that apply lets you invoke the function with arguments as an array; callrequires the parameters be listed explicitly. |