![]()
![]()
![]()
Use LEFT and RIGHT arrow keys to navigate between flashcards;
Use UP and DOWN arrow keys to flip the card;
H to show hint;
A reads text to speech;
41 Cards in this Set
- Front
- Back
|
Community |
a community is defined as an assemblage of species living close enough together for potential interaction |
|
|
Community Ecology |
is the study of members of a multispecies assemblage that interact with each other and their surroundings |
|
|
Respiration energy in energy flow |
is heat unavailable for further energy transfer |
|
|
Matter on earth |
is in a closed system just changes form |
|
|
Energy on earth |
is a open system |
|
|
Ecosystems are built with resources |
sunlight water time space nutrients food |
|
|
All Resources have |
Limitations |
|
|
Limitations create |
Stress |
|
|
Ecosystems balance between |
Resource supply and Limitations |
|
|
Adaptions are result of natural selection which enables |
organism to escape stress and access more resources |
|
|
Ability to access resources and escape stress results in? |
being able to survive, able to reproduce and able to finds its niche |
|
|
Not all stress is resources based |
HEAT AND DESSICATION COLD AND FREEZING EXPOSURE HERBIVORY/PREDATION INJURY PARASITES DISEASE |
|
|
What creates the identity and the fundamental functions of an ecosystem |
its limiting resources and stress (ex. how much water and nutrient in the soil) |
|
|
name plant adaption in desert enviroments |
Drought avoidance--> only active when non stressful Drought tolerance --> succlent (fat plants) helps retain water Efficient nutrient use |
|
|
Name Animal adaptions in deserts |
Drought avoidance--> nocternal and rapid life cycle Drought tolerance--> store water and conserve water Heat tolerance--> dissipate heat (ears) |
|
|
Plant adaptions in ontario forests |
Shade avoidance--> Height and Rapid phenology Winter dormancy--> roots and seed Shade tolerance--> rapid response to light |
|
|
Animal adaptions in ontario forests |
winter avoidance--> die(insects) , migrate or hibernate Winter tolerance--> physical change( fat, fur,) bheavioural change, burrows antifreeze |
|
|
Communites can be defined by ? |
physical (abiotic) or Biological (dominant species type) |
|
|
Three set that define local communities |
Taxnomic--> same species family Guild--> expolit same resource Functional Group--> same methods different resources |
|
|
how do you map local communities |
food web or interaction web |
|
|
Community structure |
is the set of characteristic that shape a community species diversity species compostion(it's identity) physical structure (ex layers) |
|
|
What are the 2 historically views of community structue? |
clements--> super oragnism Geason--> individualistic concept |
|
|
Gleasons community structure |
species respond to conditions individually and species associations are not fixed every one for them selves |
|
|
Clements community structure |
super organism species associations are consistent reflect common responses to environment cooperative co evolution between species everyone helps each other |
|
|
Which modern ecological perspective was adopted? |
Gleasonian individualistic concept |
|
|
Bio Diversity |
Biodiversity number and variety of living organisms includes genetic diversity species and ecological diversity |
|
|
Species diversity |
number of species and how abundant they are |
|
|
Species Richness |
The number of species in a defines community |
|
|
abundance can be measured in |
density= number of individual in a sample bio mass= weight of living material percent cover = amount of ground covered in a given area |
|
|
Abundance vs dominance |
Abundances counts the number in individual but dominance accounts for the the species that takes up the most space |
|
|
Relative abundance |
the abundance of a species divided by total abundance of all species combined |
|
|
abundance distributions can be graphed in what way |
Frequency histogram= bar graph to see how many Rank abundance diagram= the percentage closer to 1.0 is ranked #1 that species is the most abundance |
|
|
The species area curve |
S=cA^z s=number of species a= area c= constant number of species in the smallest are z= constant (slope of the log) or LogS = logC+ z logA |
|
|
what are the problems with sampling? |
individuals--> are randomly sampled in given area Samples--> the number of plots that are recorded . Rarefaction--> more common individuals are found more often even when you resample thus giving you the curve |
|
|
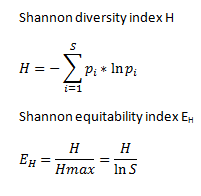
Shannon index of diversity |
number of distribution among species pi=proportion indiv/total indiv s =total number of species H=-E(sum)pi ln(pi) |
|
|
Shannon evenness shannon index diversity |
|
|
|
what types of diversity are there |
Alpha = Local diversity found within a particular habitat Beta = change in species compostion among habitats within region Gamma = Total diversity among collection of habitats |
|
|
Beat diversity |
how similar the species composition is between sites? - count # of species that differ count # of species that are same Total number of species?(species richness in sites) |
|
|
Jaccards index |
C=j/(a+b-j) j # of species found in both sites a= # of species found in site a B= # of species found in site b |
|
|
Gamma diversity |
total diversity among a collection of habitats or regional species pool |
|
|
4 Patterns of species distribution across gradient |
random, checker board, nested and turn over |