![]()
![]()
![]()
Use LEFT and RIGHT arrow keys to navigate between flashcards;
Use UP and DOWN arrow keys to flip the card;
H to show hint;
A reads text to speech;
35 Cards in this Set
- Front
- Back
|
Epidemic spread |
common source: group of persons are all exposed to an infectious agent or toxin from same source point source: type of common source where individuals become ill within one incubation period propagative: occurs from transmission from person to person over more than 1 incubation period |
|
|
Adjusted estimation |
reported cases serve as lower bound calculations based on a model determine upper bound midpoint is best guess to how many cases were actually seen |
|
|
Types of prevention |
primary prevention: prevents onset of risk behaviors --> decreases incidence (eg health education that promote healthy living) secondary prevention: screens for risk factors and early detection of asympt or mild dz --> decreases prevalence (eg community BP screening, MD support to quit smoking) tertiary prevention: reduces long-term impairment or disabilities --> decreases recurrences and slows dz progression (graded aerobic activity during recovery from MI) |
|
|
Adjusted rates |
calculated after using statistical procedures to minimize demographic differences btwn populations being compared |
|
|
Prevalence rate |
proportion of individuals with existing dz at a point of time prevalence = (ppl with existing dz / population of ppl at risk for dz) x multiplier point prevalence --> prevalence at a given time period prevalence --> prevalence over period of time good for chronic dz |
|
|
Incidence rate |
proportion of individuals developing new dz during a period of time can only be calculated over a period of time incidence rate = (ppl with dz onset / population at risk for dz) x multiplier good for acute conditions |
|
|
Prevalence pot |
determined by rates of incidence, recovery, and death prevalence = incidence x duration |
|
|
Number needed to treat |
how many ppl do you need to treat to prevent 1 case inverse of incidence rate if incidence 16 per 1,000 (16/1000) then NNT = 1000/16 = 62.5 if comparing two modulaties it is the inverse of absolute risk reduction (ARR) --> 1 / (incidence A - incidence B) where ARR = incidence A - incidence B |
|
|
Number needed to harm |
1 / (incidence of exposed - incidence of non-exposed) |
|
|
Infant mortality |
# deaths within 1yr of age / total births AA have highest rates of infant mortality bc of low birth weight & infections Native Americans have highest rate of SIDS |
|
|
Infant mortality risk factors |
maternal age (younger worse) poverty single parent family |
|
|
Years of potential life lost |
sum of yrs that ppl would have lived had they experienced normal life expectancy if life expectancy is 75 & person dies at 65 then YPLL is 10 |
|
|
Positive predictive value |
true positive / (true positive + false positive) if test is positive what is the probability that someone has the dz this is dependent on specificity |
|
|
Negative predictive value |
true negative / (true negative + false negative) if test is negative, what is probability that someone doesnt have dz this is dependent on sensitivity |
|
|
Types of studies |
|
|
|
Observational vs experimental studies |
observational: no intervention, just observe natural course experimental: there is an intervention and study determines the effect of the intervention |
|
|
Different types of observational studies |
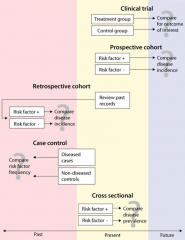
1) case report: single clinical subject or event with no control 2) case series: characterization of a group of clinical subjects 3) cross-sectional study: presence or absence of dz determined in each member of the study population or in a representative sample at a particular time --> interested in prevalence but cause and effect cannot be determined (study is at a given time) data analyzed with chi-squard test 4) case-control study: identifies a group of ppl with a dz and group w/o dz then compares them for risk factors --> mostly retrospective (study is of the past) data analyzed with odds ratio 5) cohort study: identify population who has been exposed to risk factor & is followed over time and compared with a group not exposed to the risk factor --> prospective (study is following through the future) data analyzed with relative risk |
|
|
Relative risk |
goal of observational study incidence rate of exposed group / incidence rate of unexposed group |
|
|
Attributable risk |
how many more cases in one group? incidence rate of exposed group - incidence rate of unexposed group |
|
|
Odds ratio |
odds of exposure for cases / odds of exposure for controls used for case-control studies |
|
|
3 phases of clincial trial |
Phase I: safety in healthy volunteers
Phase II: protocols and drug levels in small groups of patient volunteers (couple of 100) Phase III: efficacy and occurrence of side effects in larger group of patient volunteers |
|
|
Different types of randomized controlled clinical trials |
1) double blind: neither subjects nor researchers know whether the subjects are in the tx or control group 2) community trial: therapeutic regimen received by an entire community 3) crossover study: for ethical reasons, no group involved can remain untreated; all subjects receive intervention at different times |
|
|
Types of bias |
selection bias: sample is not representative of population (Berkson's bias) measurement bias: information is gathered in a manner that distorts the information (Hawthorne effect -> subject knows they are being evaluated so that changes performance) experimenter expectancy: experimenter's expectations inadvertently communicated to subjects (Pygmalion effect) lead time bias: gives a false estimate of survival rates recall bias: subjects fail to accurately recall events in the past late-look bias: individuals with severe dz are less likely to be uncovered in a survey bc they die first confounding bias: the factor being examined is related to other factors of less interest |
|
|
Variance and STD |
variance = (value - mean)^2 STD = sqrt (variance1 + ... + varianceN / N) +/-1 STD cover 68% of values are within mean +/- 2 STD cover 96% of values are within mean |
|
|
Standard error |
SE = STD / sqrt (N) |
|
|
Skewed curves |
negatively skewed --> mean < median < mode (tail skewed to left) positively skewed --> mean > median > mode (tail skewed to right) |
|
|
Confidence interval and significance |
if 95% CI overlap then not significant
if there is no overlap, then significant |
|
|
Relative risk and confidence interval |
if 95% CI does not contain 1.0 then is significant if RR is >1 and CI does not contain 1.0 then there is a significant increased risk if RR is <1 and CI does not contain 1.0 then there is a significant decreased risk |
|
|
Type I (alpha) error |
rejecting null hypothesis when it is really true --> think something is significant when it's not if p-value = 0.05 --> type I error is 5 in 100 (aka 1 in 20) |
|
|
Type II (beta) error |
fail to reject null hypothesis when it is false --> think something isnt significant when it is type II error= 1-power |
|
|
Power of study |
capacity to detect a difference if there is one |
|
|
Chi-square test |
you know what to expect and testing whether you are seeing that or not eg toss coin 10x, you expect 5 heads & 5 tails |
|
|
t-test |
independent group: test 2 independent groups paired sample: each group is measured 2x, once before and once after intervention one group: have only 1 group but want to compare to imaginary group |
|
|
Length time vs lead time bias |
both involve screening tests length time - testing for a dz that can have rapid or indolent progression & screening just selects for those with an indolent course thereby leading to impression screening improves survival lead time - advent of new screening test picks up test earlier but there is no change to actual duration to mortality (increasing sensitivity picks up dz earlier) |
|
|
Likelihood ratio |
Positive LR = sens / (1-spec) Negative LR = (1-sens) / spec prob of given test result occurring in a pt with a disorder compared to the prob of the same result occurring in a pt w/o the disorder not dependent on disease prevalence as PPV and NPV are |