![]()
![]()
![]()
Use LEFT and RIGHT arrow keys to navigate between flashcards;
Use UP and DOWN arrow keys to flip the card;
H to show hint;
A reads text to speech;
32 Cards in this Set
- Front
- Back
|
What differs the f test from the t test? |
F test can assess significance of more than one regression coefficient, rather than only one like the t-test --> also called F-test of joint significance |
|
|
What is the F-test of the overall significance? |
Specific form of f-test, compares model with no predictor with your model-->tests predictive capacity |
|
|
When can you use the F-test and what are the results? |
Deciding (not) rejecting null hypothesis F-value and F-critical value It assesses the overall significance of a model with jointly variables against a test with no models |
|
|
When can you reject the Null hypothesis? |
P-value: indicate the probability of the results, if p-value is smaller than alpha level --> rejecting null-hypothesis Calculated F value (range from 0 to an arbitrarily large number) larger than critical value-->reject null-hypothesis |
|
|
What does the OLS model do? |
Drawing a line/ linear relationship between one/several independent variable with a dependent variable, the optimal line given to the optimization problem-->minimum number of residuals |
|
|
What is the F-critical value? |
Threshold value that should be applied |
|
|
Which logic does the F-test follow? |
Comparing noise and signals |
|
|
What is a signal? |
Sum of squared residuals (SSR_r) of the model with more variables (n=observations; k=numbers of variables in unrestricted model; q=number of variables tested jointly) |
|
|
How can the F value be calculated? |
F = (SSR_r – SSR_u) / q x (n – k – 1) / SSR_u Compared with critical value in the F-table Cumulative distribution with two parameters (df1: q dominator; df2: n-k-1 numerator) the closer the result is to 1 the better |
|
|
What are moderators? |
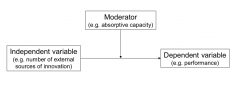
Variables that have an effect on the relationship between independent variables and dependent variables |
|
|
What is absorptive capacity? |
The skill of the people to digest new information |
|
|
Why do we have moderation or interaction effects? |
Complementarity: when 2 independent variables occur at the same time, the effects should be larger than the sum Simple regression (only linear terms) vs conditional (contains moderation effects captured by interaction terms (two variables multiplied by each other)) Often observe shift from “simple” regression to those containing moderators (interaction effects often theoretically appealing, more counter-intuitive than main effects, capture addition variance not explained by main effects) |
|
|
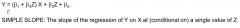
How does the simple regression look like mathematically? |
|
|
|
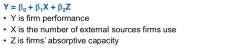
How does the conditional regression look like mathematically? |

|
|
|
How should you rearrange the conditional equation? |
|
|
|
Which values do we have to choose for Z to substitute into the regression? |
Categorical: binary Continuous: Zh, Zm, Zl corresponding to 1 s.d. above, 0 and 1 s.d. below |
|
|
Explain the (inverted)U-shaped effects |
Some increase in X has a positive effected, a lot of increase has a negative effect :Y=b0+b1X+b2X2 |
|
|
What do significant values indicate? |
There is an estimated concaveness but does not mean is has to decrease |
|
|
how can you prevent misinterpreting non-linearity? |
Using dummies instead of continuous variables before/after infliction point Look at raw data to see whether there is a U form Check low and high X if there are similar outputs on Y Split the regression, one for the increasing part, the other the decreasing |
|
|
What is the difference between mediation and moderation? |
Mediation allow to model causal chains X-->Z-->Y Moderation expresses conditional effect; condition Z determines what of effect X has on Y |
|
|
What is full mediation? |
X has no effect on Y without Z |
|
|
What are the four rules for mediation? |
The independent variable significantly predicts the mediator (a) The mediator has a significant effect on the dependent variable (b) The independent variable significantly predicts the dependent variable in the absence of the mediator (c) (not always required) The effect of the independent variable on the dependent variable shrinks/disappears when the mediator is added to the model (c’) These rules can be tested through separate regressions and observed by change in significance Also can test multicollinearity |
|
|
What does the “Sobel test” do? |
Specified T-test for the C rule |
|
|
Which limitations does OLS have? |
It only looks at one relationship and does not consider multiple variables Dependent variable is uncensored, from negative infinity to positive infinite, it becomes difficult when the DV is not normally distributed, ordinal and discrete, dichotomous variables -->other functions has to be used |
|
|
What does singular causality mean? |
Regression can only establish one causal pathway also true for mediation etc. In reality, there are multi-causality and complex, inter-dependent causal chains --> modelled through structural equation modelling (SEM) and partial leased squared (PLS) |
|
|
What is the problem with (SEM) |
The structure and relationships are based on a theoretical point of view |
|
|
What is the core logic of a threshold model? |
Certain decisions are made the threshold is crossed (e.g. everything below it =0) Only 1/0 outcomes are observed, not the actual threshold model The threshold would capture the actual probability distribution |
|
|
What should we do when we are interested in the integral under the curve? |
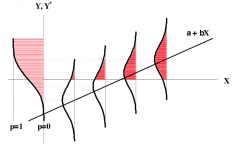
From the cumulative distribution function, we get a 0-1 bounded variableT he shape of the distribution we assume for the error of the threshold will define the steepness of the curve on the left |
|
|
What are the differences between probit and logit estimators |
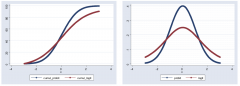
probits are a bit steeper |
|
|
What is the challenge with the logit function? |
The marginal increase is dependent on the location of the curve (it is not linear) |
|
|
How does the threshold model look like beyond dichotomous variables? |
Same logic Categorical variables (multiple thresholds, ordered Logit/Probit) Count variables (Poisson, assumes that variance=mean; negative binomial (in case of overdispersion, variance >>mean) “generalized” models GLM (generalized linear model): “improved” OLS that does not care about the distribution of error term; can almost do the same as logit, etc. Generalized ordered logit: “improved” ordered logit. Ordered logit requires that the different lines run in parallel, can be dropped here |
|
|
What is robustness check? |
Test and exclude alternative explanations Do sensitivity analysis (challenge ow core assumptions, provide alternative specification of key variables Do subsample analysis (reliability check, prediction specific sub population, robustness through secondary data) Provide additional evidence for story (different source and data |