Reading...
![]()
Play button
![]()
Play button
![]()
Use LEFT and RIGHT arrow keys to navigate between flashcards;
Use UP and DOWN arrow keys to flip the card;
H to show hint;
A reads text to speech;
78 Cards in this Set
- Front
- Back
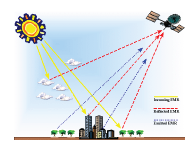
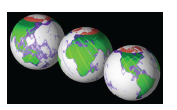
Remote Sensing
|
Process of collecting data about objects or landscape features w/o coming to direct physical contact with them.
Most remote sensing performed from orbital or sub-orbital platforms using instruments which measure reflected electromagnetic radiation. |
|

Image Interpretation: 1st order elements
|
tone - variation from white to black
color - multitude of combinations of hue, value and chroma. resolution - ability of the entire photographic system, including lens, exposure, processing, and other factors, to render a sharply defined image. |
|
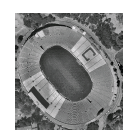
Image Interpretation: 2nd order elements
|
-geographic arrangement of objects
size: discriminate of objects and features (cars vs. buses, brush vs. trees) shape: can provide clues that aid identification -spatial arrangement of tone/color texture: frequency of change and arrangement of tones. pattern: spatial arrangement of objects |
|
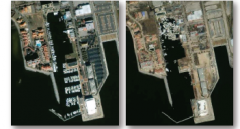
Image Interpretation: 3rd order elements
|
-locational or positional elements
site: how objects are arranged with respect to one another; or with respect to various terrain features (aspect, topography, geology). association: some objects commonly associated with one another so you can indicate or confirm existence of another. (ex. railroad tracks + coal piles + smoke stacks + cooling ponds = coal fired power plant) -interpreted from lower order elements height shadow: help identify objects. (ex. low sun angle for geologists) |
|
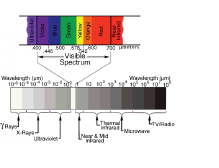
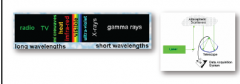
Electromagnetic Spectrum
|
The full range of wavelengths that is made up of the several different wavelengths of light emitted by the sun.
ROYGBIV |
|
Spectral Resolution
|
The number and size of the bands of the electromagnetic spectrum which can be recorded by an sensor.
|
|
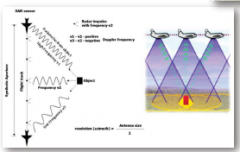
Radar Resolution
|
Range resolution
Azimuth resolution These are determined in part by the width of the synthesized antenna and the wavelength. |
|
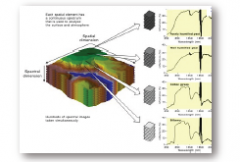
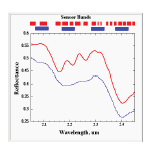
Hyperspectral Imaging
|
A powerful and versatile means for continuous sampling of broad intervals of the spectrum
|
|
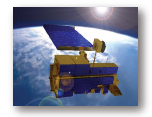
Earth Observing System (EOS) satellite Terra
|
Five state of the art sensors that will study interactions among the Earth's atmosphere, lands, oceans, life and radiant energy (heat & light).
TERRA Instruments: ASTER, CERES. MISR, MODIS, MOPIT |
|
Shuttle Radar Topography Mission (SRTM)
|
Collected radar data over 80% of all land.
Two types of antenna panels: C-band (Digital Elevation Models (DEM). ex. NED) , X-band |
|
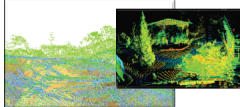
Lidar
|
Light Detection and Ranging (laser radar).
Transmits and receives electromagnetic radiation, but at a high frequency. Operates in ultraviolet, visible and infrared region of the em spectrum. |
|
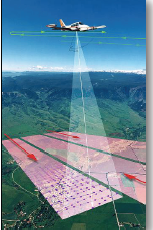
Airborne Laser Scanning
|
active remote sensing sensor that measures distance with reflected laser light.
two types of lidar systems: waveform and discrete-return. create high resolution DEMs |
|
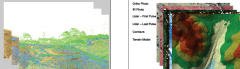
Lidar Example
|
Contra Costa County - Lidar (4inch)
|
|
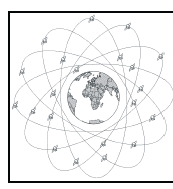
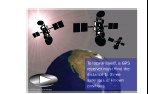
What is a GPS?
|
Global Positioning System is a global satellite based radio navigation system consisting of 27 earth-orbiting satellites in 6 different orbital paths, and their ground stations.
GPS satellites = NAVSTAR satellites |
|
How does GPS work?
|
1. Trilateration from satellites
2. Distance measured using the travel time of radio message 3. Timing - atomic clocks in satellites 4. Satellite's position in space 5. The signal's travel through the atmosphere |
|
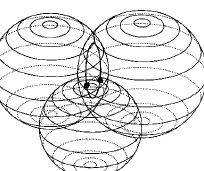
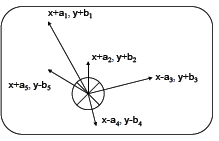
Trilateration from satellites
|
A third measurement from another satellite puts the location of the point at one of the two points where the third sphere intersects the circle.
|
|
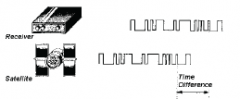
Distance measured using the travel time of radio message
|
The satellite and the receiver are synced to generate the same code at the same time.
speed of light * time = distance |
|
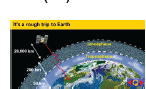
Correcting Errors
|
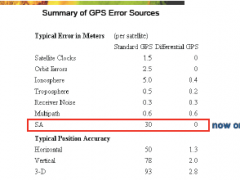
Rough trip through atmosphere, to the ground
Orbital errors Satellite geometry Intentional Errors - DOD Therefore you need to Error Budget |
|
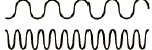
Code-Phase GPS vs. Carrier-Phase GPS
|
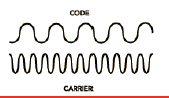
code phase: pseudo random code generated in both GPS receiver and satellite. Both matched up.
carrier phase: count exact number of carrier cycles between the satellite and the receiver. high precision, GPS surveying. |
|
Differential GPS
|
Registering and recording deviation from base station. Deviation is error added to signal for each time moment.
|
|
Justification for Land Suitability Modeling
|
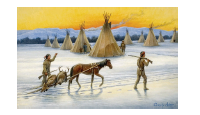
Living in Nature: used to live off what land could provide, adapt to prevalent natural conditions
Environmental Ignorance: tech innovation has brought freedom of choice of habitation and loss of importance of adjusting settlements to natural and local conditions. Some people have lost sensitivity towards environment -> natural disasters. |
|
McHarg's Suitability Analysis
|
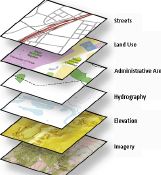
Undertaken using Spatial Feature Overlay Logic.
Technique: layer cake; polygon overlay operations central to assessing capability of a given parcel of land being suitable for a given land use. |
|

The Overlay Method
|
aka Polygon Overlay
1. Measurement and representation of phenomena on landscape (vegetation, elevation, etc. ) 2. Registration (common geometric ref. for maps) 3. Source maps > layers representing natural and social phenomena 4. Classification into factors: Constraints and Opportunities 5. Third class: Knock-Out-Constraints; land use is strictly prohibited 6. Factor maps overlayed to produce Composite maps |
|
Hand-crafted Overlay Method
|
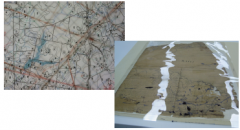
Paper or mylar map overlay
|
|
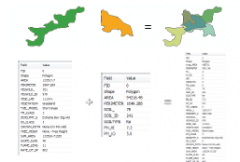
Spatial Feature Overlay Logic
|
Spatial disaggregation/aggregation
disaggregation: creating more fragments; geometry aggregation: combining more fields in one record; data tables |
|
|
Set Theory: Intersection and Union
|
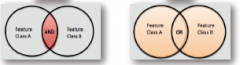
Intersection - Area of overlap
Union - Combined area |
|
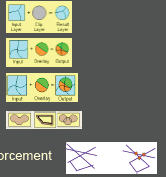
Operations requiring polygon overlay
|
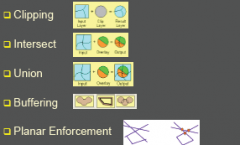
Planar Enforcement: process of building points, lines and areas from digitized spaghetti wherever intersections occur between lines.
|
|
|
Line Processing Problems
|
-Conflation: procedure of reconciling positions of corresponding features in different layers
-Edge Matching: a procedure to adjust position of features that extend across map sheet boundaries. builds a single continuous map -Editing Functions: functions to add, delete, and change geoposition of features. two lines crossing -Line Coordinate Thinning: thinning of redundant or unnecessary points to reduce data volume. -Classification and Generalization: thresholding data fields into clusters |
|
Sliver Polygons
|
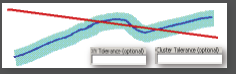
Pairs of lines which should coincide but don't b/c of differences in digitizing.
spurious polygons / "coastline weave" Solved using Fuzzy tolerance, as if line fuzzy Part of Editing Functions and Line Processing Problems |
|
|
Discrete vs. Continuous Data
|
-Discrete: measurement scale consisting of a # of separate values (ie. points, lines, polygons)
-Continuous: measurement scale where it is permissible to calculate intermediate values (interpolated surfaces derived from discrete samples) |
|

Notions of Proximity
|
-the notion of proximity or neighborliness with other observations
-proximity of all neighbors affects potential for interaction -notions of proximity effective in modeling clustering of populations -1st law of geography: "Everything is related to everything else, but close things are more closely related" - W. Tobler |
|
|
Theiseen or Voronoi Polygons
|
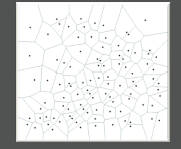
Buffered circles impacting each other to form a set of cells, a cellular network consisting of polygons.
Each cell has the same Z value |
|
|
Delaunay Triangulation
|
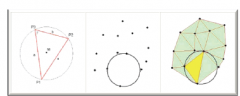
-the dual of the Thiessen or Voronoi Polygons
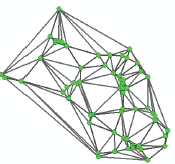
-a proximal method that satisfies the requirement that a circle drawn through the three nodes of a triangle will contain no other node. |
|
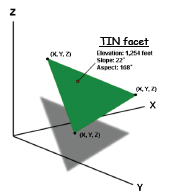
TIN
|
Triangulated Irregular Network
-represents space using a set of non-overlapping triangles that border one another and vary in size and proportion -once TIN is built, the elevation can be interpolated, slope and aspect for each triangle can be calculated. |
|
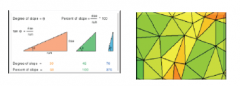
Slope in TIN
|
Calculates the maximum rate of change between each point and its neighbors
|
|
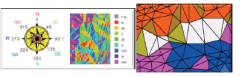
Aspect in TIN
|
Identifies the steepest down-slope direction from each point to its neighbors.
Clockwise in degrees from 0 (due north) to 360 (due north coming full circle) |
|
Contour to TIN
|
vertices of the contour lines are used as mass points for triangulation.
sometimes flat triangles appear b/c of streams or rivers. |
|
LIDAR for TIN
|
3D Point Clouds
|
|
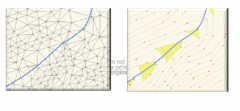
Viewshed Analysis
|
identifies the facets in an input data set that can be seen from one or more observation points or lines
|
|
|
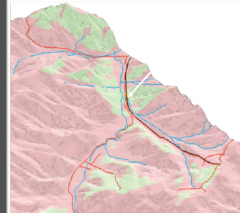
Universal Soil Loss Equation
|
Used to predict longtime average soil losses and runoff
A = R K L S C P A = computed annual soil loss R = rainfall-runoff erosivity factor K = soil erodability factor LS = topographic factor combining slope length and slope angle C = land cover and management P = erosion-control practice for crops |
|
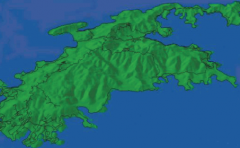
TIN Case Study
|
Erosion modeling for the island of St. John, U.S. Virgin Islands.
On island topographic relief is extreme. Lots of hurricanes. Solution: Erosion Model to find areas at risk of potential erosion |
|
|
What is a network?
|
-A system of connected linear features through which resources or events flow (ex. roads)
-Precise flow route and speed may be affected by multiple factors (ex. speed limits) |
|
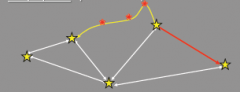
What is a network composed of?
|
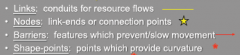
See picture
|
|
|
Location-Allocation
|
-Models attempt to improve or optimize demand conditions by allocation of supply
|
|
|
Types of Location-Allocation Models
|
Simple: supply and demand points in space, demand allocation to closest supply for optimal solution
Spatially Unconstrained: demand and supply interact in straight lines and frictions (ease of travel) constant Discrete or Constrained: embedded within a line network (transportation network), each segment and intersection has indiv. constraint parameters. |
|
|
Classes of Location-Allocation Problems
|
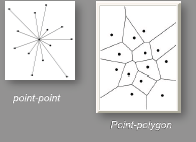
Point-Point class
Point-Polygon class |
|
|
Types of Networks
|
Straight-line
Branching Circuit |
|
|
Network-based Analysis
|
Capacity Analysis: load the network and look for bottlenecks and capacity problems
Gravity Model: determine (many-to-many) flows along multiple-link routes |
|
|
Point-polygon location problems
|
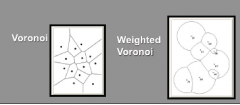
Unconstrained allocation: Voronoi or Theissen polygons
Contrained allocation: weighted Voronoi |
|
|
Networks Modeling Case Study
|
Sherman Island, Sacramento-San Joaquin Delta
modeled levees failing and its affect on accessibility of emergency response. Solution: fire station (rescue worker) in each high risk neighborhood. |
|
|
Spatial Interpolation
|
Estimating the value of a variable of interest an an un-sampled location based on the values measured at sampled locations.
|
|
|
Why Spatial Interpolation?
|
We cannot sample everywhere.
-too expensive, tedious, physically impossible, inaccessible, cloud cover, forest canopy |
|
|
Typical Inputs/Outputs of Interpolation
|
-Points to Points
-Points to Lines: contours -Points to vector polygons -Points to raster grids |
|
|
Sampling Strategies
|
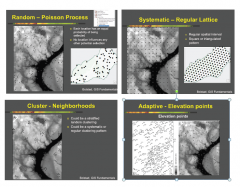
-Random samples
-Uniform samples -Cluster sampling: cluster center identified randomly or systematically, with cluster of samples around center -Adaptive sampling: fewer samples taken in homogeneous areas; higher sampling densities where feature of interest is heterogeneous |
|
|
Main Characteristics of Interpolation Methods
|
-Global vs. Local
-Exact vs. Inexact -Deterministic vs. Stochastic |
|
|
Global vs. Local Estimators
|
Characteristic of Interpolation Methods
Global: use all sample points to estimate values at unsampled locations Local: estimates are based on neighboring points |
|
|
Exact vs. Inexact Estimators
|
Characteristic of Interpolation Methods
Exact: the values at input sample locations have same values in the output surface Inexact: output surface where values at the original sample locations may be estimates |
|
|
Deterministic vs. Stochastic Methods
|
Characteristic of Interpolation Methods
Deterministic: based on a mathematical model -Natural neighbors: Thiessen polygons -IDW: inverse distance weighted -spline functions Stochastic: based on a geostatistical model that incorporates random variation and accounts for spatial autocorrelation. -kriging |
|
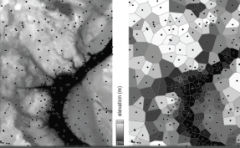
Thiessen Polygon Interpolation
|
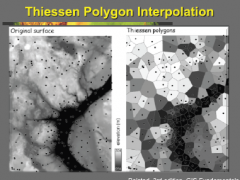
-local estimator
-exact estimator -deterministic |
|
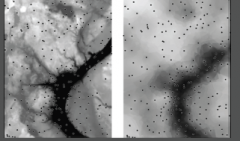
IDW Interpolation
|
Inverse Distance Weight
-IDW derives an estimate based on user defined parameter for the # of sample points, I -the user can also input a power parameter, n -local, exact, deterministic |
|
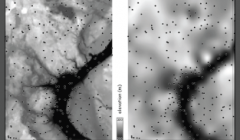
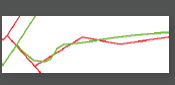
Splines
|
Creates the smoothest possible line along the set of points, (flexible ruler)
For surface creation, spline functions are like bending a rubber sheet to pass through all sample points |
|
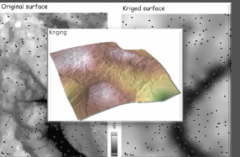
Kriging
|
Statistically based estimator of spatial variables.
Incorporates: 1. spatial trend: increase or decrease towards a direction 2. spatial autocorrelation: tendency for points near each other to have similar values 3. random variation 3 components combined in mathematic model to create estimation function |
|
|
Descriptive Spatial Statistics
|
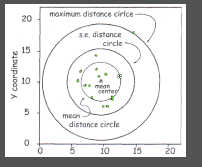
Mean Center
Mean Distance Circle Standard Error Distance Circle Max Distance Circle |
|
|
Central Moments
|
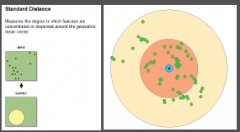
1st central moment: Spatial Mean
2nd central moment: 1st, 2nd standard deviation |
|
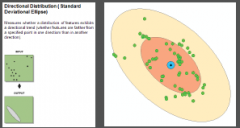
Spatial Metrics: Direction
|
1st and 2nd standard deviational ellipse: measure of whether a distribution of features exhibits a directional trend
|
|
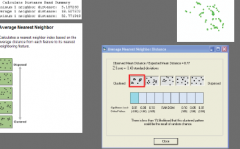
Average Nearest Neighbor
|
Calculates a nearest neighbor based on the average distance from each feature to its neighboring feature
|
|
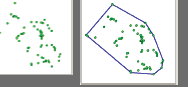
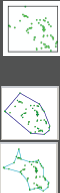
Convex Hull
|
A set of points enclosed by connecting the outermost points in the set using exterior angles >= 180 degrees.
|
|
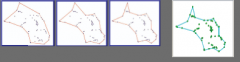
Concave Hull
|
A set of points enclosed by connecting the outermost points in the set using exterior angles < 180 degrees
|
|
Spatial Metric
|
Delauney Triangulation, Spatial Descriptor
A maximum planar skeleton |
|
Spatial Metric
|
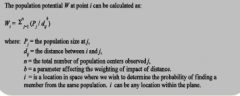
Beta Skeleton, Gabriel Graph (after K.R. Gabriel)
Endoskeleton graph the smaller the beta, the more lines |
|
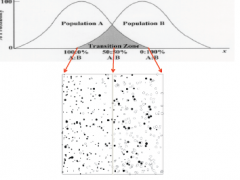
Notions of Proximity to create boundaries
|
based on notions of proximity or neighborly
delineates the transition zone about the boundary draws boundaries between homogeneous areas Example of methods: Voronoi tessellation method, Gravity model method |
|
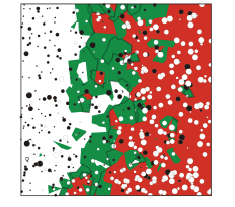
Boundary and Transition Zones
|
Voronoi tesselation: predict the potential of any potential of any given polygon being associated with a particular population
|
|
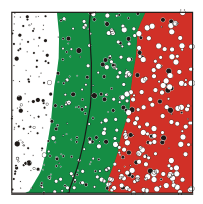
Boundary and Transition Zones
|
Gravity model: weighted and unweighted models
|
|
Beta-skeletons
|
Generalize process of using disc or empty circles in a plane.
Have properties similar to construction of DT Can construct spectrum of endoskeletons, family of beta-skeletons |
|
|
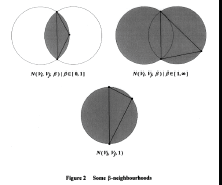
Street Center Application
|
Use both lune and disc based neighborhood methods to generate street centerlines (lune, DT) and intersections (disc, GG)
|
|
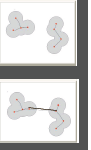
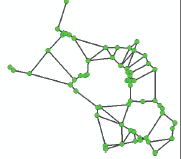
Minimum Spanning Tree
|
1. closest neighbors connected
2. closest neighborhoods connected |
|

Endoskeleton graphs
|
-Nearest neighbor graph
-Minimum spanning tree -Relative neighborhood graph -Gabriel graph -Delaunay Triangulation |
|
Exoskeleton graphs
|
-Min. bounding box, circle, ellipse
-Convex hull, alpha-hulls |