![]()
![]()
![]()
Use LEFT and RIGHT arrow keys to navigate between flashcards;
Use UP and DOWN arrow keys to flip the card;
H to show hint;
A reads text to speech;
28 Cards in this Set
- Front
- Back
|
Prediction |
The term used to describe what a regression model does. |
|
|
Dependent Variable Y |
The variable that a regression model seeks to predict. Also known as the response variable. |
|
|
Independent Variable X |
A variable that a regression model seeks to use to predict the dependent variable. |
|
|
Least-Squares Method |
The calculational method that minimizes the sum of the squared differences between the actual values of the dependent variable Y and the predicted values of Y. |
|
|
Simple Linear Regression |
The regression model that uses a straight line (linear) relationship to predict a numerical dependent variable Y from a single numerical independent variable X. |
|
|
Simple Linear Regression Equation |
|
|
|
Slope (b1) |
SSXY/SSX |
|
|
SSXY |
The sums of X and Y minus the sum of X multiplied by the sum of Y divided by the sample size. |
|
|
SSX |
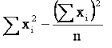
The sum of each X variable squared minus the total sum of X squared divided by the sample size. |
|
|
Intercept (b0) |
mean Y - slope * mean X |
|
|
Residual |
The difference between the observed and predicted values of the dependent variable Y for a given value of X. |
|
|
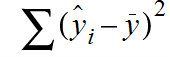
Regression Sum of Squares |
The variation that is due to the relationship between X and Y. SSR = SUM (Predicted Y value - mean Y value)^2 |
|
|
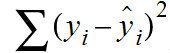
Error Sum of Squares |
The variation that is due to factors other than the relationship between X and Y. SSE = SUM (Observed Y value - Predicted Y value)^2 |
|
|
Total Sum of Squares |
The measure of variation of the Yi values around their mean. SST = SUM (Observed Y value - Mean Y value)^2 |
|
|
Coefficient of Determination |
The ratio of the regression sum of squares to the total sum of squares, represented by the symbol r^2. |
|
|
SSR |
Equivalent to intercept * sum of Y + slope * sum of XY - minus (sum of Y)^2/n. |
|
|
SSE |
Equivalent of sum of Y^2 - intercept * sum of Y - slope * sum of XY. |
|
|
SST |
SSE + SSR |
|
|
Coefficient of Correlation |
The measure of the strength of the linear relationship between two variables, represented by the symbol r. Basically, the square root of the coefficient of determination. |
|
|
Standard Error of the Estimate |
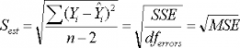
The standard deviation around the fitted line of regression that measures the variability of the actual Y values from the predicted Y, represented by the symbol S_yx. |
|
|
Standard Error of the Slope |
Or the standard error of the estimate divided by the square root of the sum of squares X. |
|
|
t Test Statistic |
sample slope/standard error of the slope |
|
|
Confidence Interval Estimate of the Slope |
b1 +- t_n-2 * Sb1 Multiply the t statistic by the standard error of the slope and then add and subtract the product to the sample slope. |
|
|
Multiple Regression Model |
The statistical method that extends the simple linear regression model by assuming a straight-line or linear relationship between each independent variable and the dependent variable. |
|
|
Net Regression Coefficients |
The coefficients that measure the change in Y per unit change in a particular X, holding constant the effect of the other X variables. Also known as partial regression coefficients |
|
|
Multiple Regression Equation |

|
|
|
Coefficient of Multiple Determination |
The statistic that represents the proportion of the variable in Y that is explained by the set of independent variables included in the multiple regression model. |
|
|
The Overall F Test |
The test for the significance of the overall multiple regression model. |