Reading...
![]()
Play button
![]()
Play button
![]()
Use LEFT and RIGHT arrow keys to navigate between flashcards;
Use UP and DOWN arrow keys to flip the card;
H to show hint;
A reads text to speech;
44 Cards in this Set
- Front
- Back
|
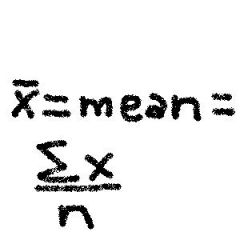
What is the mean?
|
the measure of center in a data set by adding the data values and dividing the total by the number of data set values
|
|
|
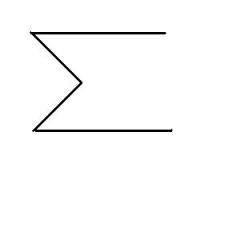
What is the symbol for Sum of set data values?
|
|
|
|
What is the mean formula?
|
|
|
|
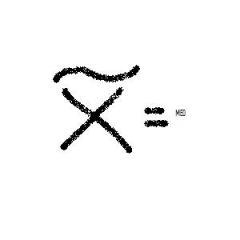
What is the symbol of the median?
|
|
|
|
What is the median?
|
data set that is the middle value of the original data values arranged in order of increasing (or decreasing ) magnitude.1) If data is ODD the median is the exact number in the middle of the data set. 2) If data set is EVEN compute the mean if the two middle numbers
|
|
|
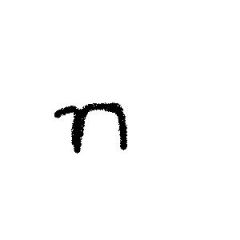
What is the symbol for the number of data sets? *hint its a lower case letter
|
|
|
|
What is the Mode?
|
In a data set, its the value that occurs the most. If # is the same its either bimodal (X2) or multimodal (2+). No number means no mode.
|
|
|
What is the midrange?
|
measure of center that is the value midway between the maximum and minimum value in the original data set.
(max data value + min data value) / 2 |
|
|
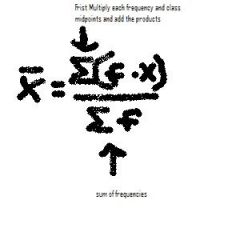
What is the formula for finding the mean from frequency distribution?
|
|
|
|
What is skewed?
|
A data set that is not symmetric. Either left skewed or right skewed. *hint area that is skewed looks like a chunk was taken out thus right skewed looks like a chunk is missing on the right.
|
|
|
What is the symbol of standard deviation (from a sample) in the TI83?
|
|
|
|
What is the range?
|
R= range and its the data set values which is the difference between max and min data value.
range= (maximum data value) - (minimum data value) |
|
|
What is the standard deviation?
|
an average variation of the value of the mean
|
|
|
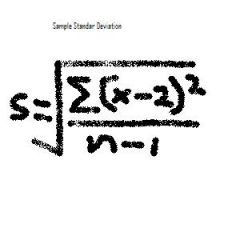
What is the standard deviation formula?
|
|
|
|
What is a variance?
|
in a set of values is a measure of variation equal to the square of the standard deviation.
|
|
|
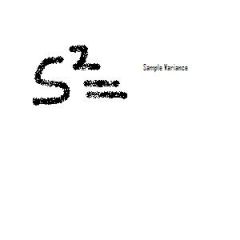
What the variance symbol?
|
|
|
|
What is the symbol of sample variance in ti83?
|

|
|
|
What is the range rule of thumb?
|
for most data sets, the vast majority of sample values lies within two s (standard deviation) of the mean.
|
|
|
What is the minimum "usual" value?
|
= (mean) - 2s(standard deviation)
|
|
|
What is the maximum "usual" value?
|
= (mean) + 2s(standard deviation)
|
|
|
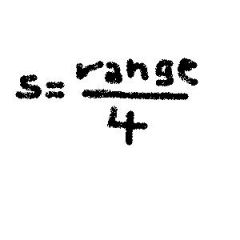
What is the formula for estimating a value of the standard deviation s?
|
|
|
|
What is the empirical rule?
|
data sets having a distribution that is approximately bell shaped.
* 68% of all vales fall within the 1 standard deviation of the mean *95% of all vales fall within the 2 standard deviation of the mean *99.7% of all vales fall within the 3 standard deviation of the mean |
|
|
What is Chebyshevs theorem?
|
The proportion (or fraction) of any set of data lying within K standard deviation of the mean is always at least 1-1Ksquared where K is any positive number greater than 1. For K=2 or K=3, we get-
*at least 3/4 (or 75%) of all values lie within 2 standard deviation of the mean. *at least 8/9 (or 89%) of all values lies within 3 standard deviation of the mean. |
|
|
What is CV?
|
Coefficient of variation
|
|
|
What is Coefficient of variation?
|
non negative sample or population data, expressed as a % described the standard deviation relative to the mean.
|
|
|
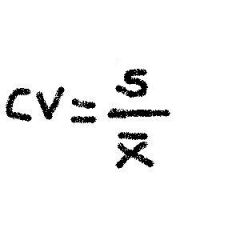
What is the formula for CV?
|
|
|
|
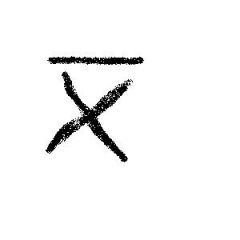
What is the symbol for mean in Ti83?
|
|
|
|
What is the symbol for standard deviation sample in Ti83?
|

|
|
|
What happens to the histograph when the mean and median are to the right of the mode?
|
The histograph is right skewed
|
|
|
What happens to the histograph when the mean and median are to the left of the mode?
|
The histograph is left skewed
|
|
|
How do u calculate outliers in a box and whisker plot?
|
above Q3 by an amount greater than 1. X IQR or below Q1 by an amount greater than 1.5 X IQR
|
|
|
What do the 5 summary numbers mean in a box and whisker plot?
|
The minX, Q1, median, Q3 and the maxX
|
|
|
How do u find the IQR (Interquartile range)?
|
IQR= Q3 -Q1 ( the range of the box )
|
|
|
What is a z score?
|
converting a value to a standardized value
|
|
|
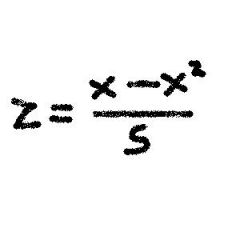
What is the formula for z score (or standardized value)?
|
|
|
|
What are percentiles?
|
are measures of location denoted by p1, p2 . . ., p99, which divide a set of data into 100 groups with about 1% of the values in each group.
|
|
|
What is the formula for finding the percentile of a data value?
|
number of values less than X
----------------------------------------- X 100% total number of values |
|
|
What is n?
|
total number of values in the data set
|
|
|
What is the k?
|
percentile being used (ie. for the 25th percentile, k=25)
|
|
|
What is L?
|
Locator gives the position of the value (ie. for the 12th value in the sorted list, L=12.)
|
|
|
What is Pk?
|
kth percentile (ie. P25 is the 25th percentile)
|
|
|
How do you convert the kth percentile to the corresponding data value?
|
L= (K)
------ X n (100) |
|
|
After converting if L is not a whole number what do u do?
|
If not- the value of L is midway between the Lth value and the next value in the sorted data. Find PK and adding the Lth value and divide by 2.
|
|
|
After converting if L is a whole number what do u do?
|
Change the L by rounding to the nearest whole number and the value of PK is the Lth value counting from the lowest.
|