![]()
![]()
![]()
Use LEFT and RIGHT arrow keys to navigate between flashcards;
Use UP and DOWN arrow keys to flip the card;
H to show hint;
A reads text to speech;
17 Cards in this Set
- Front
- Back
- 3rd side (hint)
|
Anecdote |
Not evidence. Story of personal experience. If your friend recommends a Ford and it falls apart, who's experience is more typical? Maybe the car is reliable and you received a lemon. |
|
|
|
Treatment vs Control Group |
Treatment receives the treatment. Control receives placebo. |
|
|
|
Outcome variable is also called the |
Response variable |
|
|
|
How is an observational study organized? Is it reliable |
Subjects are merely observed and placed in categories by their own actions. Treatment group consists of the group of interest-- ex) if the study is on smokers, then smokers would be the treatment. |
|
|
|
Do observational studies show causal? |
No. Subjects self select their group, which eliminates randomization. Also because of confounding variables. |
|
|
|
Define: Data, Variable, Variation |
Data- Numbers with context Variable- attribute that varies for a data set Variation- changes of items in a data set |
|
|
|
Stacked vs Unstacked data |
Stacked- 1 variable per column/row [height, weight, gpa] Unstacked- A similar variable across 2 columns that don't allow a 3rd variable. [Men's height vs womens height] |
|
|
|
Coding |
Person with attribute of interest gets a 1, others get a 0. |
|
|
|
Context of data |
Who or what was observed? Babies What variables measured? Birth weights How were variables measured? Scale Who collected data? University Where were data collected? Hospital? 1 hospital will not represent all baby birthweights in US. Why was data collected? When was it collected? LSD use in the 70s would affect birth weight to that time vs today. Who what where when how and why |
|
|
|
4 features of a well designed experiment (controlled experiment) |
Large sample Random assignment to each group Double Blind Placebo |
|
|
|
Distribution of a sample |
A way to organize data based on values observed and the frequencies of these values |
|
|
|
Histogram vs Bar Chart vs Pareto Chart |
Histogram- Natural ordering (ascending??). For numerical values. Gap only where no values are present. Width of bars have meaning.
Bar chart- Categorical and usually unable to order-- ex) eye colors. Bar width has no meaning. Gaps between bars.
Pareto- A type of bar chart listing frequencies in ascending order |
|
|
|
Mean describes |
Balancing point of data set |
|
|
|
When mean and Median is preferred |
Median when data is strongly skewed or has outliers Mean when data is relatively symmetrical and has FEW data points |
|
|
|
2 Way Table |
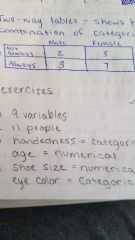
Shows how many times each combinations of categories occur. |
|
|
|
Standard Deviation is used for what kind of data? |
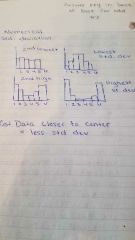
Numerical |
|
|
|
Variance |
(X-Xbar)squared The average of the squared differences from the mean. |
|