![]()
![]()
![]()
Use LEFT and RIGHT arrow keys to navigate between flashcards;
Use UP and DOWN arrow keys to flip the card;
H to show hint;
A reads text to speech;
48 Cards in this Set
- Front
- Back
|
Case |
Object described by a set of data |
|
|
Label |
Special variable to distinguish from other cases |
|
|
Variable |
Characteristic of a case |
|
|
Distribution |
Describes how the values of a variable may vary from case to case |
|
|
Pareto Graph |

Bar chart with frequency of variable arranged with longest bars on the left and shortest on the right The curve is smoothed and represents the cumulative percentage as we move from left to right |
|
|
Histogram |
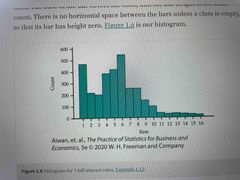
Looks a lot like a bar graph but shows the distribution of counts with in the range of a variable |
|
|
Stem Plot |
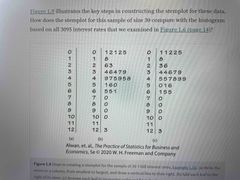
Quick way to produce the information of a histogram, back of the enevelope |
|
|
Time Plot |
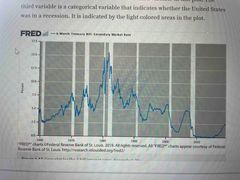
Line graph that measures a single variable against time. Time is always up on the horizontal axis. |
|
|
Five Number Summary |
Minimum Q1 M Q2 Maximum |
|
|
Boxplot |

Graph of the five number summary Central box spans quartiles Line in box marks median Whiskers mark max and min or some other cases some boundary. |
|
|
IQR = |
Q3 - Q1 Interquartile Range |
|
|
S = |

Standard deviation |
|
|
68 95 99.7 rule |
In a normal distribution, at one standard distribution away from the mean 68% of the observation are contained, at two 95% at 3 99.7% |
|
|
Z = |
(X - μ) / σ |
|
|
Z-score |
How many standard deviations the original observation falls away from the mean |
|
|
R = |

Back (Definition) |
|
|
Sxy = |

Covariance is the measure of the direction of the relationship between two variables. A positive covariance means both variables tend to be high or low at the same time. A negative covariance means that when one variable is high the other tends to be low. |
|
|
Least squares regression line |

Line that makes the sum of the squares of the vertical distance of the data points from the line as small as possible |
|
|
R squared = |

Back (Definition) |
|
|
Explanatory Variable |
Manipulate to get a response X |
|
|
Responsive Variable |
What changes as a result of the explanatory variable Y |
|
|
X bar |
The mean of x |
|
|
Y bar |
The mean of y |
|
|
Y hat |
The predicted value of y given x |
|
|
Residual = |
Y - y hat The residual J’s difference between the observed variable and value predicted |
|
|
|

Back (Definition) |
|
|
Regression Line |
Straight line that describes how y (responsive variable) changes as x (explanatory variable) changes |
|
|
Lurking Variable |
A variable that is not among the explanatory or response variables in a study, may influence the interpretation of relationships among those variables. |
|
|
Treatments |
Conditional studied in an experiment- what we change |
|
|
Experimental Unit |
Cases that are assigned to a treatment in an experiment. Subjects when it’s humans |
|
|
9 Threats to Internal Validity |
Omitted Variables, Trends in outcomes, misspecified variance, mismeasurement, political economy, simulaneity, selection, attrition, omitted interactions |
|
|
Omitted Variables |
Variables that skew our results that we did not measure |
|
|
Stratification/Blocking |
Moving experimental units into blocks that should be representative and effective |
|
|
Permutation vs combination |
Permutation-Meaningful order of variables President, Vice president, assistant Combination- order does matter Member of the board |
|
|
Union U |
A U B A or B or both can occur |
|
|
Intersection |
Intersection where A and B are existing simultaneously |
|
|
Compliment |
A^C or A’ |
|
|
Disjoint |
O with a cross through it Completely unrelated |
|
|
Kolmogorov’s Probability Axioms |
1. The probability of everything adds up to 1 or 100% 2. Probability of an event is a non negative number 3. If number are disjoint and there is no probability mass in the area between them then they are fine |
|
|
Internal Validity- Trends in outcomes |
Existing trends that explain the difference in the dependent variable |
|
|
Internal validity- misspecified variance |
The groups, treatment vs control, have their own differences which effect the results |
|
|
Internal Validity: Mismeasurements |
Changes in definitions or survey methods |
|
|
Internal validity: political economy |
Government expects results due to past or expected future outcomes |
|
|
Internal validity: simultaneity |
Two variables are changed simultaneously but not a direct result of each other such as the interest rates of 5 year and 10 year bonds |
|
|
Intersection |

Intersection where A and B are existing simultaneously |
|
|
Compliment |

A^C or A’ |
|
|
Internal validity: Omitted interactions |
Trends and interactions of variables ommitted from the model. Think of a < shaped graph, we would model it as -. |
|
|
3 Threats to external validity |
Does not generalize to selection, setting, or time period |