![]()
![]()
![]()
Use LEFT and RIGHT arrow keys to navigate between flashcards;
Use UP and DOWN arrow keys to flip the card;
H to show hint;
A reads text to speech;
25 Cards in this Set
- Front
- Back
|
Time-cost relationship and factors |
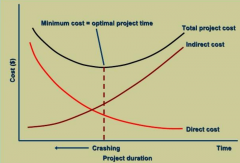
Direct factors: - Crowding - additional supervision - overtime - extra delivery costs Indirect factors: - salary for supervision - utilities - rent - site equip and temp struct. |
|
|
Resources 4Ms |
Money Materials Machines Manpower |
|
|
consequences of fluctuating resources |
- admin costs (recruitment training, storage, learning) - cost of idling or overtime - overcrowding or logistic problems - uncertainty of resources - poor productivity/more from inconosistent work groups |
|
|
Resource levelling constraints |
Limited Resources: project is delayed to keep withing resource lim Time: aims to reduce resc fluctuations by using floats |
|
|
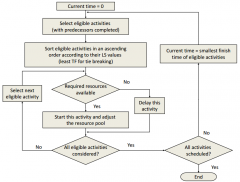
resource limited algorithm |
|
|
|
Advantages of linear scheduling |
- more intuitive than network - more info than bar charts - production rates areclearly show - resource utilizations are maximized - location is clearly shown - learning curve increase priductivity |
|
|
Linear scheule formulas |
C = R * D (# of Crews) = (Production rate) * (Duration) R = (n-1)/(TL - T1 + TF) R: Rate of delivery n: number of units TL: time to finish T1: time for one unit TF: float time for each activity |
|
|
PERT acronym and steps |
Program Evaluation and Review technique 1) Build Network sched 2) Est. Tm, Tb, Ta (most likely, posseimistic and optimistic) 3) Est. Te (expected) and σ (std dev) of each activity 4) CP for Te 5) Sum Te and σ^2 (variance) for whole project 6) Define normal dist of the project duration becomes normalized by Central limit Theorem |
|
|
Notes on PERT |
- Higher variance more uncertain schedule - Small number of activities causes PERT to fail - Independant activity durations causes PERT to fail - the CP is fixed for PERT, and that can cause under estimation |
|
|
Monte Carlo simulation |
Random samples to create a model Uses random number genereators (RNGs) to repeat schedule many times with varying durations and calcs a predicted |
|
|
Project control definition |
Project management function - compares actual to planned performance - takes appropriate corrective action - to yield desired outcome |
|
|
EVA and rel. terms |
Earned value analysis BCAC - Budgeted cost at completion BCWS - Budgeted cost of work scheduled BCWP - Budgeted cost of work performed ACWP - Actual cost of work performed BQAC - Budgeted quantity at completion AQWP - Actual quantity of work performed |
|
|
EVA indexes |
CV - Cost variance = BCWP -ACWP SV - Schedule variances = BCWP - BCWS CPI - Cost performance index = BCWP/ACWP SPI - Schedule performance index = BCWP/BCWS CPI and SPI > 1 is good |
|
|
Retainage |
Money held back by the owner until completion |
|
|
How to reduce overdraft |
- initial payback - shorter payback - less retainage - use subcontracting |
|
|
NPV |
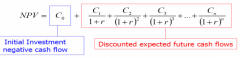
Net present value r = discount rate (opportunity cost) |
|
|
IRR |
Internal rate of return the discount rate for an NPV of 0 |
|
|
top causes of fatalities and injuries |
Fatalities:: Falls Transportation Contact w/ objects Exposure Other Injuries: Bodily reaction/exertion Contact / objects Falls Exposure Transportation Other |
|
|
Cost of accidents |
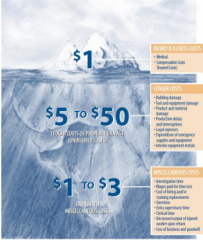
iceberg Injury and illness: medical, compensation Ledger costs (uninsured) Miscellaneous costs |
|
|
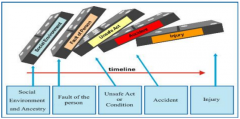
Heinrichs domino theory |
|
|
|
DART |
The incident rate for recordable cases involving days away from work, days of restricted work activity or job transfer (DART) |
|
|
incident rates |
incidents per # of workers per time e.g. # / 100 workers / year |
|
|
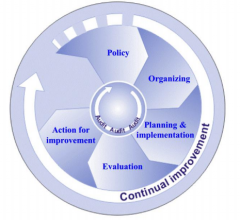
Construction safety improvement |
|
|
|
BBS |
Behavior- Based Safety Improvement Observation Feedback Continuous improvement |
|
|
ABC Model |
Construction safety management Antecedent - prompt peoples actions - precede the behaviour - communicate info - work only for short term if no consequences Behaviour Consequences - stronger than antecedents - strengthen or weaken behaviour - self feedback vs feedback from others |