![]()
![]()
![]()
Use LEFT and RIGHT arrow keys to navigate between flashcards;
Use UP and DOWN arrow keys to flip the card;
H to show hint;
A reads text to speech;
34 Cards in this Set
- Front
- Back
|
What does a survivorship curve show? |
The number or proportion of individuals surviving to each age for a given species |
|
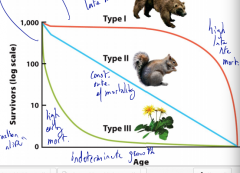
Describe what this graph shows |
Type 1- High late life mortality Type 2- Constant rate of mortality Type 3- High early mortality |
|
|
What does λ show in the life table? |
(n1/No)=N2/100>1 increasing |
|
|
Age structure of a population does not change over time; fraction of individuals at each age is constant |
Stable age distribution |
|
|
The total number of female offspring that we expect an average female to produce over the course of her life |
Net reproductive Rate (Ro) |
|
|
How do you calculate Ro |
Count all ages (Probability Surv to x) (number offspring) (sum of x Ix and bx) |
|
|
What does an Ro greater than 1 mean? |
Growing population |
|
|
What does an Ro <1 mean? |
Shrinking population |
|
|
If you could increase a females fertility by a single additional offspring at which age would you do so in order to increase population growth the most? |
Early life age |
|
|
The average time between the birth of an individual and the birth of its offspring |
Generation Time (T) |
|
|
Relationship between T and Ro |
T is the generation time, and Ro is the rate of growth |
|
|
Life table follows a group of individuals born at the same time from birth to the death of the last individual |
Cohort life table |
|
|
What is the problem with cohort life tables? |
They take a long time to measure |
|
|
Life table that quantifies survival and fecundity of all individuals in a population during a single time interval |
Static life table |
|
|
What does a static life table assume? |
assume life table is stable as mates of mortality/ fertility not changing over time |
|
|
Populations fluctuate naturally over |
Time |
|
|
What can density dependence with time delays cause? |
Populations to be inherently cyclic |
|
|
What can cause small populations to go extinct? |
Chance events |
|
|
Metapopulations are composed of subpopulations that can experience what? |
Independent population dynamics across space |
|
|
Why do all populations experience fluctuations? |
Factors such as availability of resources, predation, competition, disease, parasites and climate |
|
|
T or F: population fluctuations are always small |
False, can be bigger |
|
|
Does body size play an effect on population fluctuations? |
Yes, small body size have larger variations in populations and large body size (more homeostasis) tend to have smaller fluctuations |
|
|
How can you tell a baby boom from an age graph? |
It goes out wider |
|
|
How can long-term fluctuations in age structure be determined? |
In some species by looking at patterns in body growth |
|
|
when a population grows beyond its carrying capacity |
Overshoot |
|
|
A decline in density that typically goes well below the carrying capacity often after population overshoots its carrying capacity |
Die-off |
|
|
regular oscillations in population size over a significant period of time |
Population cycles |
|
|
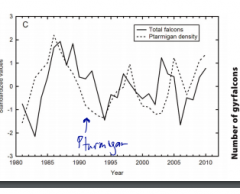
Population cycle graph |
|
|
|
Why do population resources fluctuate? |
climate |
|
|
What is an example of a cyclic population? |
Phytoplankaton with chlorophyll |
|
|
The phytoplankton and falcon timeseries are likely examples of density _______ and _____ factors regulating population size? |
dependent and independent |
|
|
Consistent periodicity in fluctuations is unlikely to be drive by what? |
Random variation in the environment (weather and natural disasters) |
|
|
Populations have momentum like a swinging pendulum where what? |
Gravity can incrementally ad or subtract velocity (growth rate) but momentum causes it to overshoot the center (allows for overshoot and die off) |
|
|
How can population cycles be modeled? |
By starting with the logistic growth model |